Learning Candlestick Patterns
In the previous posts I described an Reinforcement Learning approach to “Learning the Exit” part 1, part 2. My initial conclusions there have been:
- reward smoothing (with the labeler) leads to more robust results than a reward on position exit
- without smoothing the learning process struggled and had more volatility from epoch to epoch
- obtained the best results with smoothed reward
- obtained better results with discrete actions (such as enter, hold, exit) rather than continuous
- continuous action distributions appears to be much harder to learn, and the algorithms, such as DDPG or TD3 are much slower to evaluate than DQN or PPO2
- PPO2 produced the best results, roughly 30% better than DQN
- the results showed actionable positive P&L after accounting for transaction costs and expected slippage
- however did not get as close as I would like to the optimal reward in many scenarios
In terms of improving RL performance, thought I could improve the information available to the agent by adding a feature that classifies the current price-action in terms of:
- in momentum
- in trend
- momentum or trend at an end or turning point
- sideways price movement or noise
The goal for the RL strategy is to hold a position through a momentum or trend period in the direction of profit, and exiting when the features signal an end to momentum or a turning point in direction. I provided the model with a number of features that assist in this decision, however did not have a feature encoding any information that might be present in the “chart”. I am not a chartist, however there is undoubtedly information present in the price volume activity as seen in a chart.
A Possibility
I came across an article Identifying Candlestick Patterns using Deep Learning, which attempts to train a DL model to “become a chart reader”, effectively. The aproach:
- use one of the top trained (million parameter) deep-learning vision models as the basis
- produced images of candlestick charts, incrementing a rolling window across time
- retrained the outer layers to learn a new objective (transfer learning) against these chart images
- attempted to predict a fixed period forward return
The use of transfer learning, that of taking a trained vision model, stripping off the final layers and retraining a new set of final layers, was interesting.
However, I had the following reservations regarding the approach:
- complexity and suitability of a vision model with a million parameters
- concerns about complexity adding to my trading environment
- the chart domain is much simpler and regular than the objects these models are trained on, not ideally suited
- using fixed period return labels is not robust.
- a positive or negative return could have real support or could just be noise
- I found that t+5 returns often triggered a non-zero label due to apparent noise, and did not seem to be part of a move or have prior support in the price or volume.
A Better Approach
Rather than use an enormously complicated model, had the view that could create a simplified representation of a “chart” and apply classification. Like the above approach, I would present the prior K bars in some form as features to a ML classifier, providing indication of individual and overall geometry. Furthermore, I needed to address the labeling problem; avoiding noisy labels to the extent possible.
Labeling
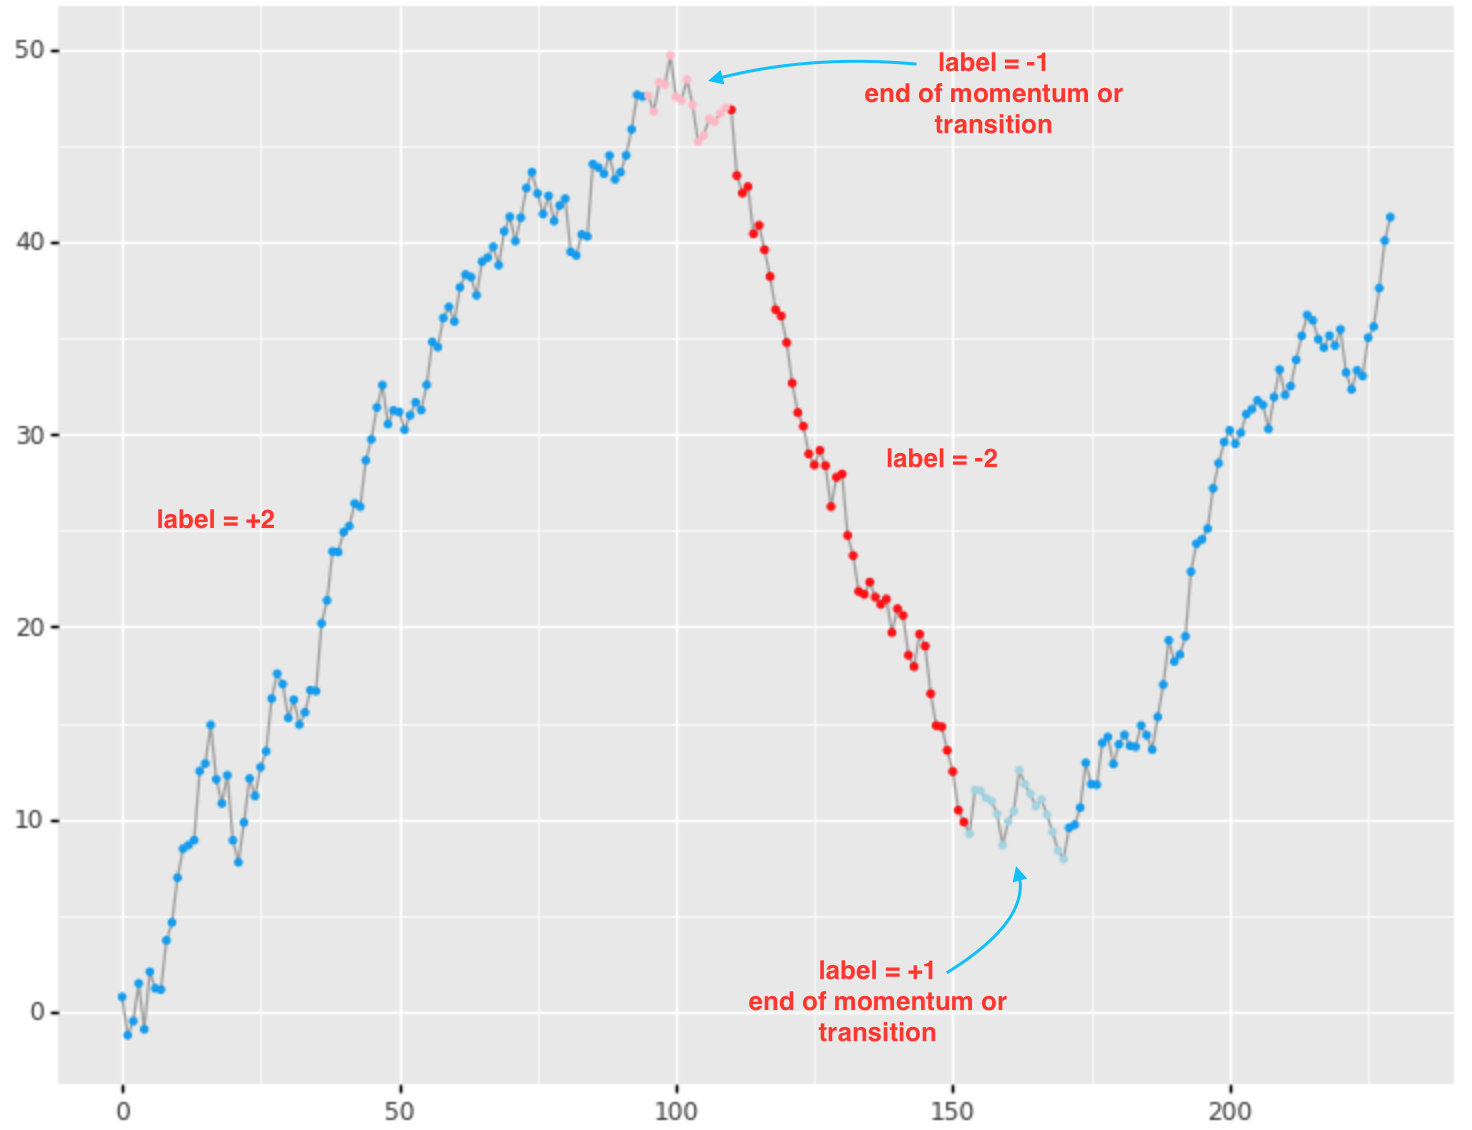
In terms of labeling made use of a variation of our labeler to label in the following manner:
- +2 / -2 for upward and downward momentum or trend with minimum magnitude of 3.5 x bar ATR
- -1 / +1 for end of momentum or momentum direction transition periods
- 0 for sideways or noise
Features
The next question was, what set of features captures the geometry of the chart pattern? I started with simple features, with the notion that could add more sophistication, as and if necessary:
- for each bar in our rolling window (for example 20 bars):
- normalized open to high
- normalized open to low
- normalized open to close
- percentage change in volume relative to a rolling MA on volume
- rolling cumulative return from start of window (this give the model a sense of geometry across the chart)
- generate the above for 1min bars during market hours across a 10 year period
- I did not experiment with other bar granularities, but expect that “fatter” bars would tend to produce higher accuracy since they carry more aggregate information, and smooth out noise. However, I need to balance between timeliness (bar frequency) versus potential gains in accuracy for longer periods.
Just as with the labeling, I used each asset’s ATR as a normalizer so that the same model could be applied across a portfolio.
Results
Using a random forest classifier, obtained the following accuracies out-of-sample:
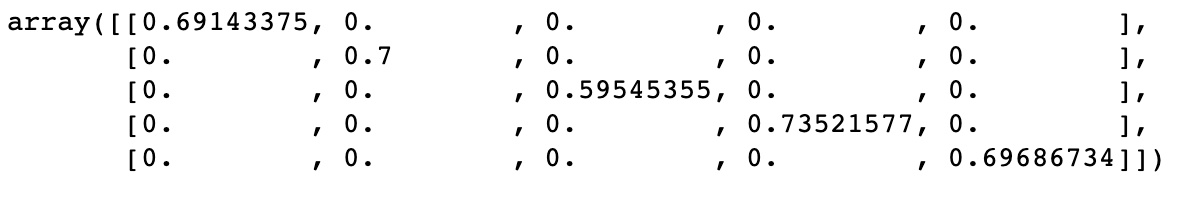
where the diagonal represents accuracies for labels { -2, -1, 0, +1, +2 } respectively. I was surprised with the level of accuracy given the rather simple features. The transition period labels { -1, +1 } did especially well, which is useful. I took the same model and applied it to other equitie and it gave similar accuracy, which was reassuring.
A friend of mine (thanks Steve W.), suggested that I take the prior bar prediction and feed that into the model as a new feature. So for time \(t\), use the label predicted by the original model \(f(x_{t-1})\), augmenting the feature set and training a new model \(f(x_t, f(x_{t-1}))\). This improved the results significantly:
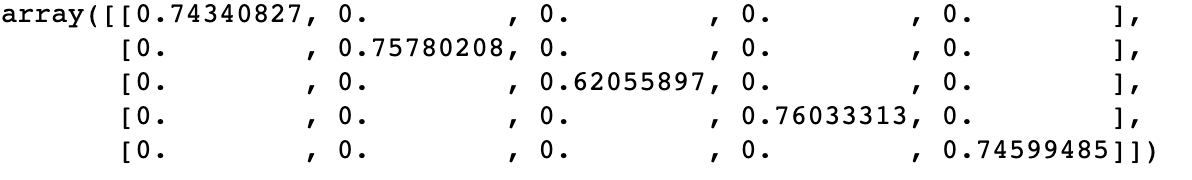
improving from 69% on the directional labels to 74%, as well as improving on the neutral and transition labels.
Discussion
While the predictions are quite high, some thought is required in terms of how to use as a trading strategy in its own right. Correctly predicting the label for 1 min is not a return easily captured, and was not the intent of the labeling. The directional labels point to a bar belonging to a persistent market move, rather than being individually actionable. The transitional labels are likewise useful in identifying the end of market moves.
The end goal was to produce another feature that would assist the RL algorithm in determining optimal exit strategy. The signal can be used on its own however, taking into account the meaning assigned to these labels.
Possible Next Steps
- produce classification for longer bars, augmenting the finer grain predictions
- consider an exit approach without RL using this signal (to avoid the extra complexity of RL)
- add as feature in RL and determine whether there is a significant advantage of RL over signal-based heuristics
- evaluate the predictions as a trading strategy in its own right