Labeling Momentum & Trends
There are times when need to label a time series, identifying periods of momentum, trend, mean-reversion, etc. Directionaly labeling timeseries has a wide variety of applications:
- labels can be used for supervised learning
- analysis of microstructure around larger price moves
- conditional analysis using label (pattern) sequences
- testing online signals versus idealized ex-post labeled trend / momentum or MR targets
The Problem
The naive approach to labeling might just note the sign of individual returns in a series. However, most bars or samples in a timeseries present a non-zero return, though may be noise for a given trading target.
Another approach, often used, is to apply smoothing to the price series or vwap, removing noise (for example with a penalized spline, smoothing kalman filter, lowess spline, etc). Traditional smoothing algorithms do not adapt smoothing to slow or fast regimes, and therefore fail to capture:
- high degree of smoothing: fails to capture fast moves OR
- low degree of smoothing: captures fast moves but does not mask high frequency low amplitude noise
Top-Down Approach
From a trading perspective I wanted an algorithm that detected moves with:
- amplitude > some minimum return (for example in intraday FX, 15bps minimum)
- noise < some maximum
A few years ago developed an algorithm to label momentum and trend patterns in intra-day or daily price data based on the above two criteria. In spite of its simplicity, has performed quite well as compared to a number of more complicated statistical approaches have developed. I have implemented this in my own proprietary libraries, but thought I would contribute more broadly for a change of pace - launched a new python and R package implementing the approach here:
- python version:
- https://github.com/tr8dr/tseries-patterns
- R version:
- https://github.com/tr8dr/r-tseries-patterns
I have moved to using python primarily for research purposes, so will not be adjusting the R package often.
Examples
Below are some examples of the same (intra-day) data series, parameterized for more noise, less noise, higher or lower minimum amplitudes.
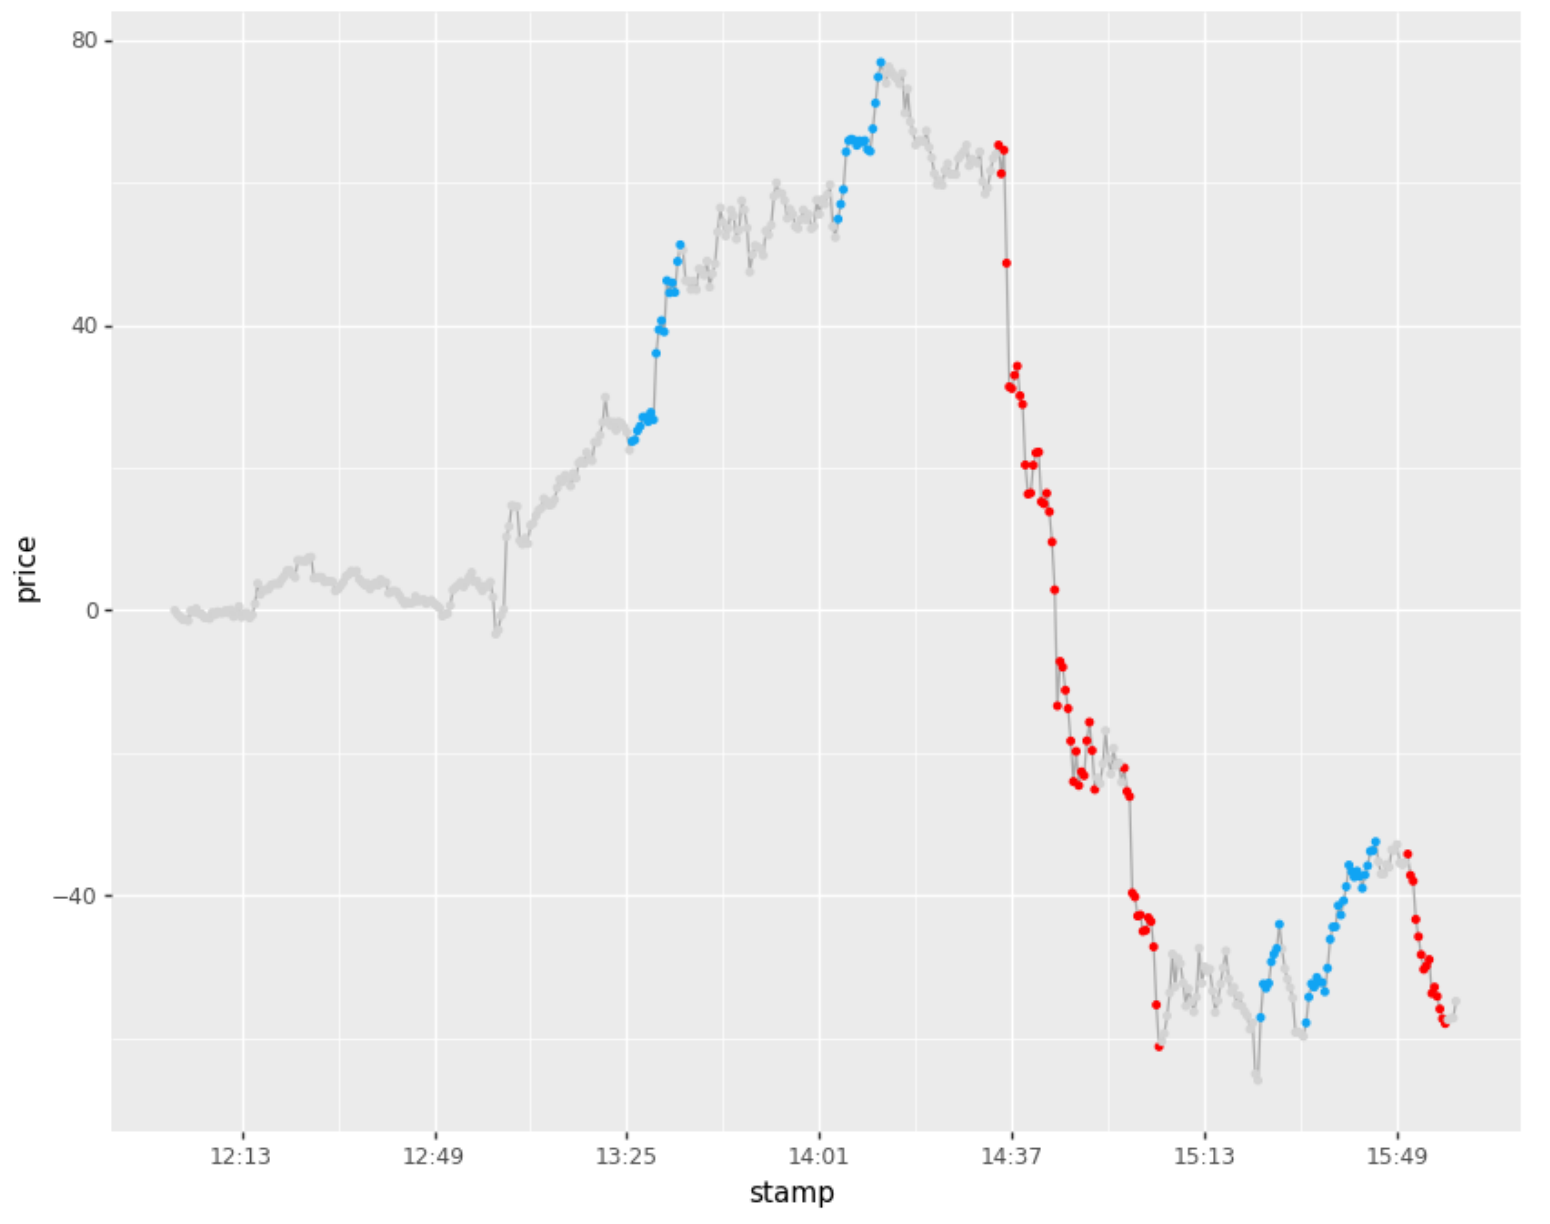
Labeling (minamp = 20bps, Tinactive = 5mins)
Note that this was performed on 30sec sampled bars, so Tinactive = 10, corresponds to 10 30sec bars = 5mins
labeler = AmplitudeBasedLabeler (minamp = 20, Tinactive = 10)
labels = labeler.label (df)
labeler.plot()
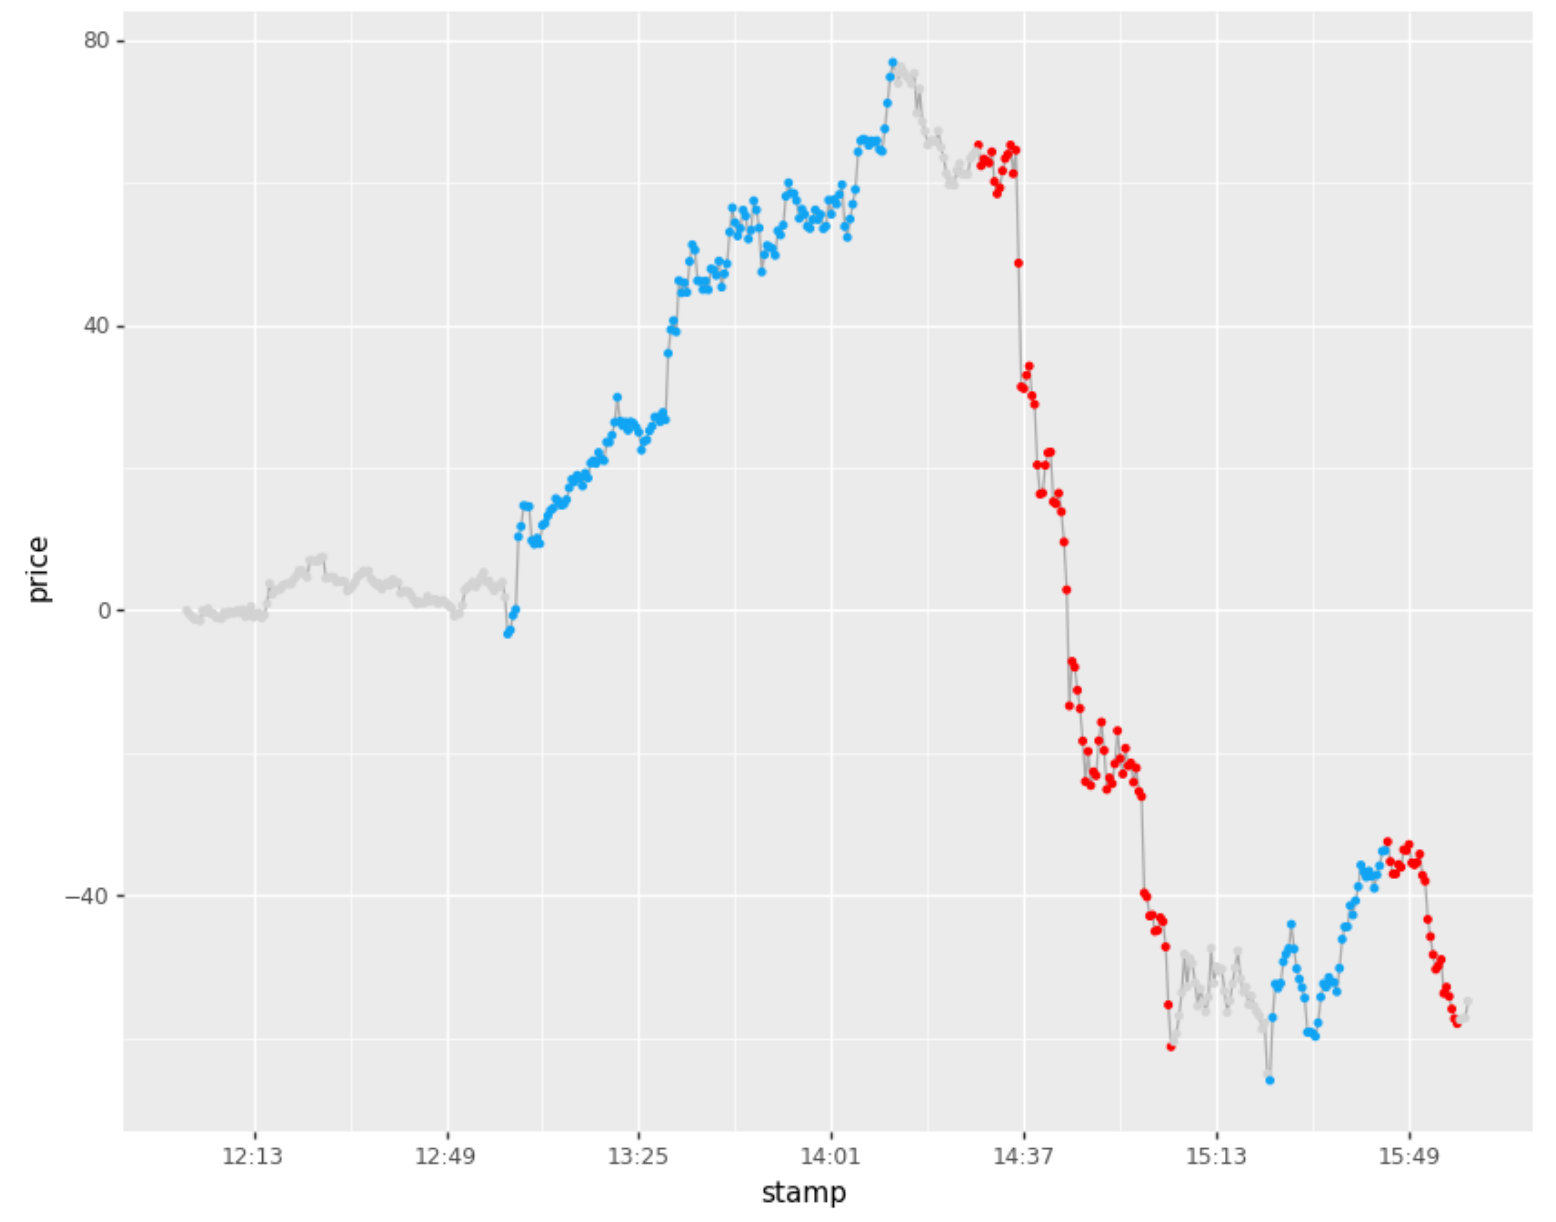
Labeling (minamp = 20bps, Tinactive = 15mins)
Note that this was performed on 30sec sampled bars, so Tinactive = 30, corresponds to 15mins
labeler = AmplitudeBasedLabeler (minamp = 20, Tinactive = 30)
labels = labeler.label (df)
labeler.plot()
Further Enhancements
The labeler does a good job of finding momentum / trend extents, however does not have a formal view of noise, other than a notion of price inactivity, where no new highs (lows) are achieved within a broader move. The identified sections can be further filtered, evaluating noise in a variety of ways:
- Traditional volatility measures (however these may not capture what a trader is looking for)
- Wavelet decomposition of price during the move, evaluating the power spectrum
- Finding a best-fit, 0 inflection spline for the move and determining ratio of RSS to slope (for example)
- …
I have implemented and use a variety of these in determining whether to use a move conditionally in trading.