Buy / Sell Imbalance
indicators I use
Problem
It is fairly easy to recognize price momentum with price-based indicators ex-post or with lag. Price based momentum signals tend to have lag issues in recognizing the start and end of a price move as there is a tradeoff between noise and lag [1] that can’t be defeated without future information (due to principles from signal processing).
[1] For those interested see impulse-response and the relationship between response delay and degree of smoothing by a filter. Zero lag smoothing with a traditional filter can only be achieved with Forward-Backward smoothing (using data from the future).
Buy / Sell Imbalance
In lit markets (where we can see orders and trades), there is additional information that can be applied towards recognizing price moves (or at least directional trading):
- advertised size on the orderbook
- though one has to be careful about spoofing and other techniques to mask or mislead on direction
- skewed activity in the orderbook
- order placement, cancelation activity pointing to algo or trader buying
- trades: whether a buyer or seller aggressed
- every crossed order involves two trades. The order that crossed with a standing order is the aggressing order and the aggressing side (buy or sell).
In this case we will focus on trades. Most price moves above a certain magnitude will show skewed buying (selling) activity where the majority of aggressive crossing orders are in one direction. Some markets provide an indication of which side aggressed a specific trade:
- CME / Globex and associated futures exchanges
- provides a flag to indicate side of trade for orders placed at prices above the BBO (best bid, best offer)
- Crypto exchanges
- provide aggressing side for all exchange trades
- note that big trades are often done OTC, however, and therefore not visible except in the blockchain eventually
- EBS (FX)
- it has been a while since I used EBS, but believe EBS Live provides a sampling of trades with aggressor side
There are many other exchanges which provide trades, however without buy/sell attribution:
- equity exchanges
- some non-bank FX venues
- various bond venues
- …
Early research into buy / sell imbalance focused on classification of trades as buyer initiated or seller initiated. Probably the first published approach in this regard was the Lee-Ready technique (circa 1991), which made use of the position of a given trade’s price relative to a prior BBO mid-point to determine whether was likely buyer or seller originated. This was followed by a variety of alternative approaches, one of which will discuss in a later post. Here is a good reference to some of the approaches.
Trade volume tends to be clustered and is best modeled with a point process (in particular a Hawkes Process). The Hawkes process is a counting process that models the arrival of events over time. In this case would be used to model the arrival of unitary buyer or seller originated orders at time t. The process is “self exciting” in that each arrival (trade) excites the process, in the sense that the frequency and magnitude of subsequent arrivals (trades) is increased (and decays once new arrivals diminish). This is expressed as:
\[H(t) = \mu (t) + \sum_{t_i < t} N(t_i) e^{-\kappa (t - t_i)}\]where \(\mu (t)\) is the mean arrival rate, \(N(t_i)\) is the magnitude or number events at time \(t_i\) and \(\kappa\) is the decay. When the decay (\(\kappa\)) is small, an event will excite the process for a longer period of time.
For our buy / sell indicator we will evaluate it as follows:
- let \(\mu (t)\) be 0, since we expect an even number of buys and sells as the baseline behavior
- \(N(t_i)\) is the magnitude of buys - sells per bar (or if evaluating per trade, would be the sign and magnitude of the trade)
This is realized as:
\[BSI(t) = \sum_{t_i < t} (buyvolume_{t_i} - sellvolume_{t_i}) e^{-\kappa (t - t_i)}\]Or as a recurrence relation:
\[BSI(t) = BSI(t-1) e^{-\kappa \Delta t} + (buyvolume_{t_i} - sellvolume_{t_i})\]Discussion & Examples
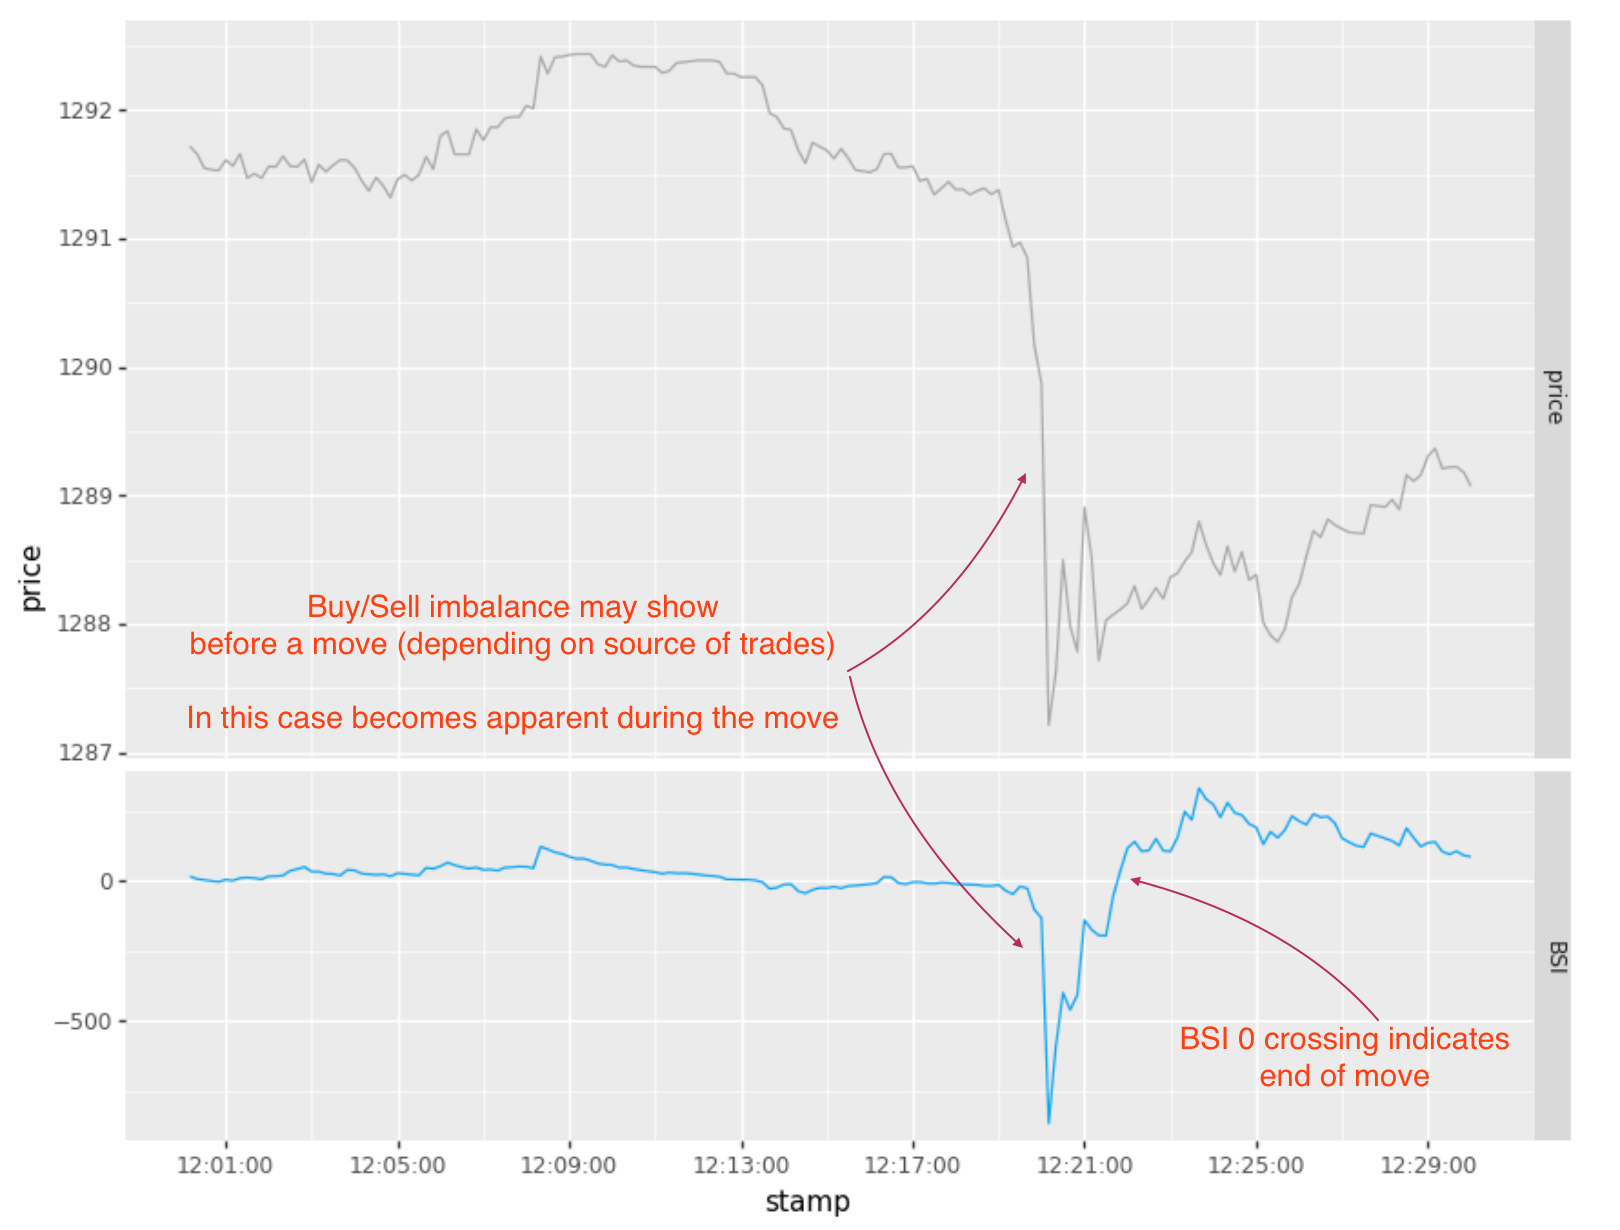
The buy sell imbalance usually develops ahead of a visible price move, as trading drives price moves. If you have access to a full view of the market or a particular exchange where the move originates, should see an early indication of buy/sell imbalance, presaging the move. However, one may not have full visibility on the market, the visible slice will be a proxy for the overall activity behind the move.
In either case, I have found that BSI:
- can be an early signal prior to or at inception of move
- provides better information as to when to exit than price-based indicators
Example 1
In this particular example, I did not have access to all trades across the market, just trades from one source (a market for Gold). The initial trading for this move started 5 minutes before the large drop (I believe), but most of it traded away from this market early on or was done passively. Hence BSI, here, only signals once the pace of trading becomes apparent on the futures exchange.
Find the code for this example in my new open-sourced timeseries patterns library tseries-patterns.
df = pd.read_csv("csv/volumebars.csv", parse_dates=['stamp'])

bsi = HawkesBSI(kappa = 0.1)
bsi.eval (df)
bsi.plot(title="variation with kappa = 0.1")
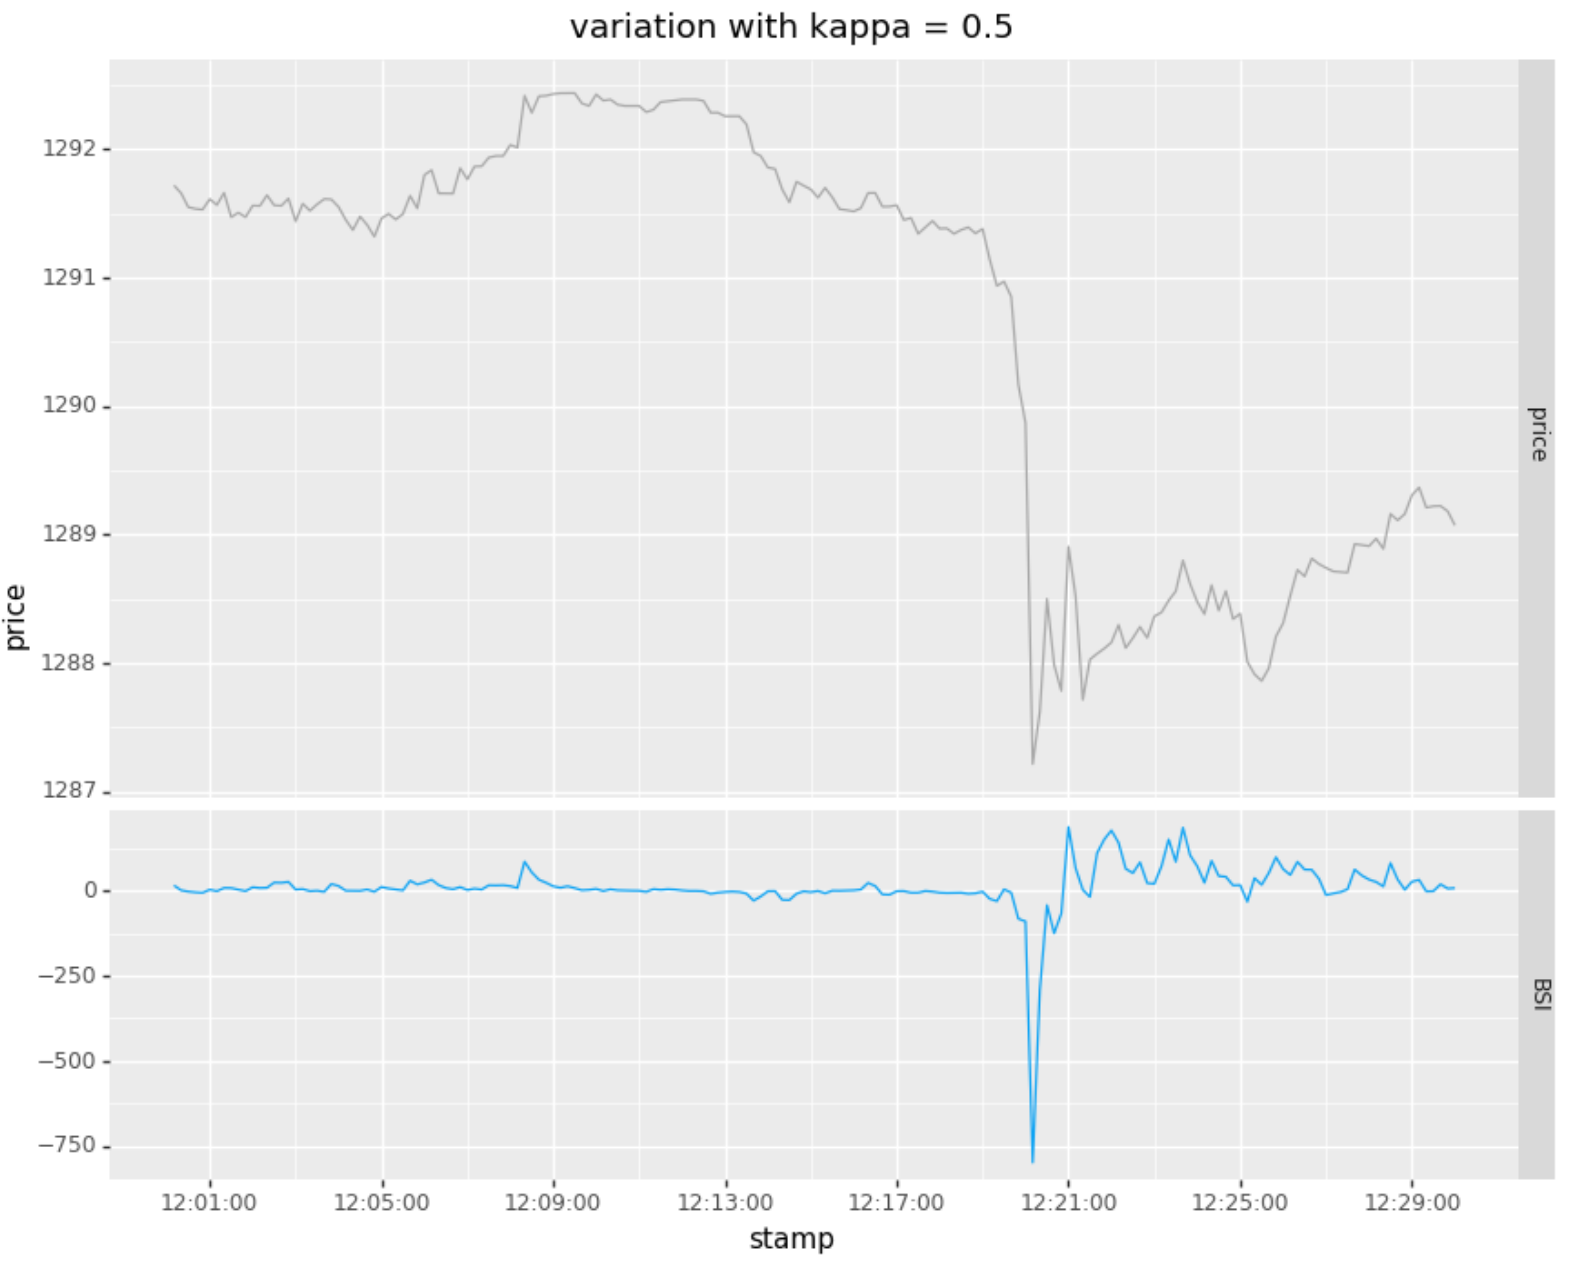
Here is the same time period with a faster decay:
bsi = HawkesBSI(kappa = 0.5)
bsi.eval (df)
bsi.plot(title="variation with kappa = 0.5")
Implementation
I have implemented BSI and variants thereof in C++, F#, Kotlin, and Python over the years. As mentioned above, have created an open source Python library, where am starting to share some of the indicators I use, called tseries-patterns. Will be adding to this library over time, so suggest watching the repository if is of interest. Appreciate any feedback.