Crypto Trading Depth
I have a collection of crypto stat/arb strategies I plan to trade as a portfolio of strategies. Each strategy trades a small mean-reversion portfolio of loosely cointegrated coins, based on a bayesian state-based model. The returns in cryptos for this sort of strategy are phenomenal, however, finding enough size can be difficult for some coin portfolios.
In my universe of roughly 220 coins, there is significant variation in liquidity, requiring that I size these strategy portfolios very differently depending on the coin composition. Ultimately, the most robust answer re: achievable scale lies in live-testing, however wanted to get some indicative view on liquidity apriori.
Some relevant measures:
- spread-to-sweep
- spread required to clear k$ in liquidity (with an aggressive order sweeping multiple levels of the order book).
- one would rarely sweep the book to achieve a large $ amount unless there was an arbitrage, massive risk event, or wanted to impact the market, however is useful in understanding book depth.
- maximum size achievable within k bps, and time period
- Using trade data we can observe the $ amount that was filled within k bps of a reference price within a given time period.
- For different k bps buckets can produce a distribution of achieved size.
Implementation
Many of the coins in my portfolio universe are traded on Binance and/or FTX. Using Binance trade data observed the following:
Create distribution of size / price-spread bucket, conditional on:
- up, down momentum or none
- low, medium, high volatility
- day of week
- time of day
- aggressive or passive size
The approach was to:
- choose a reference price on a sliding window (from a buyer or seller perspective)
- we evaluate the size distribution for some forward period across the time series relative to the price at the start of the window
- observe the conditional variables (above) to classify volume
- evaluate the size / spread cost distribution over periods: 5min, 10min, 15min .. 30min
- replay trades to see what could be captured at various spread to base price levels
- size by time-of-day, day-of-week
- size differences as relates to volatilty and momentum
- size achievable over different time periods
- size achievable for a given spread cost
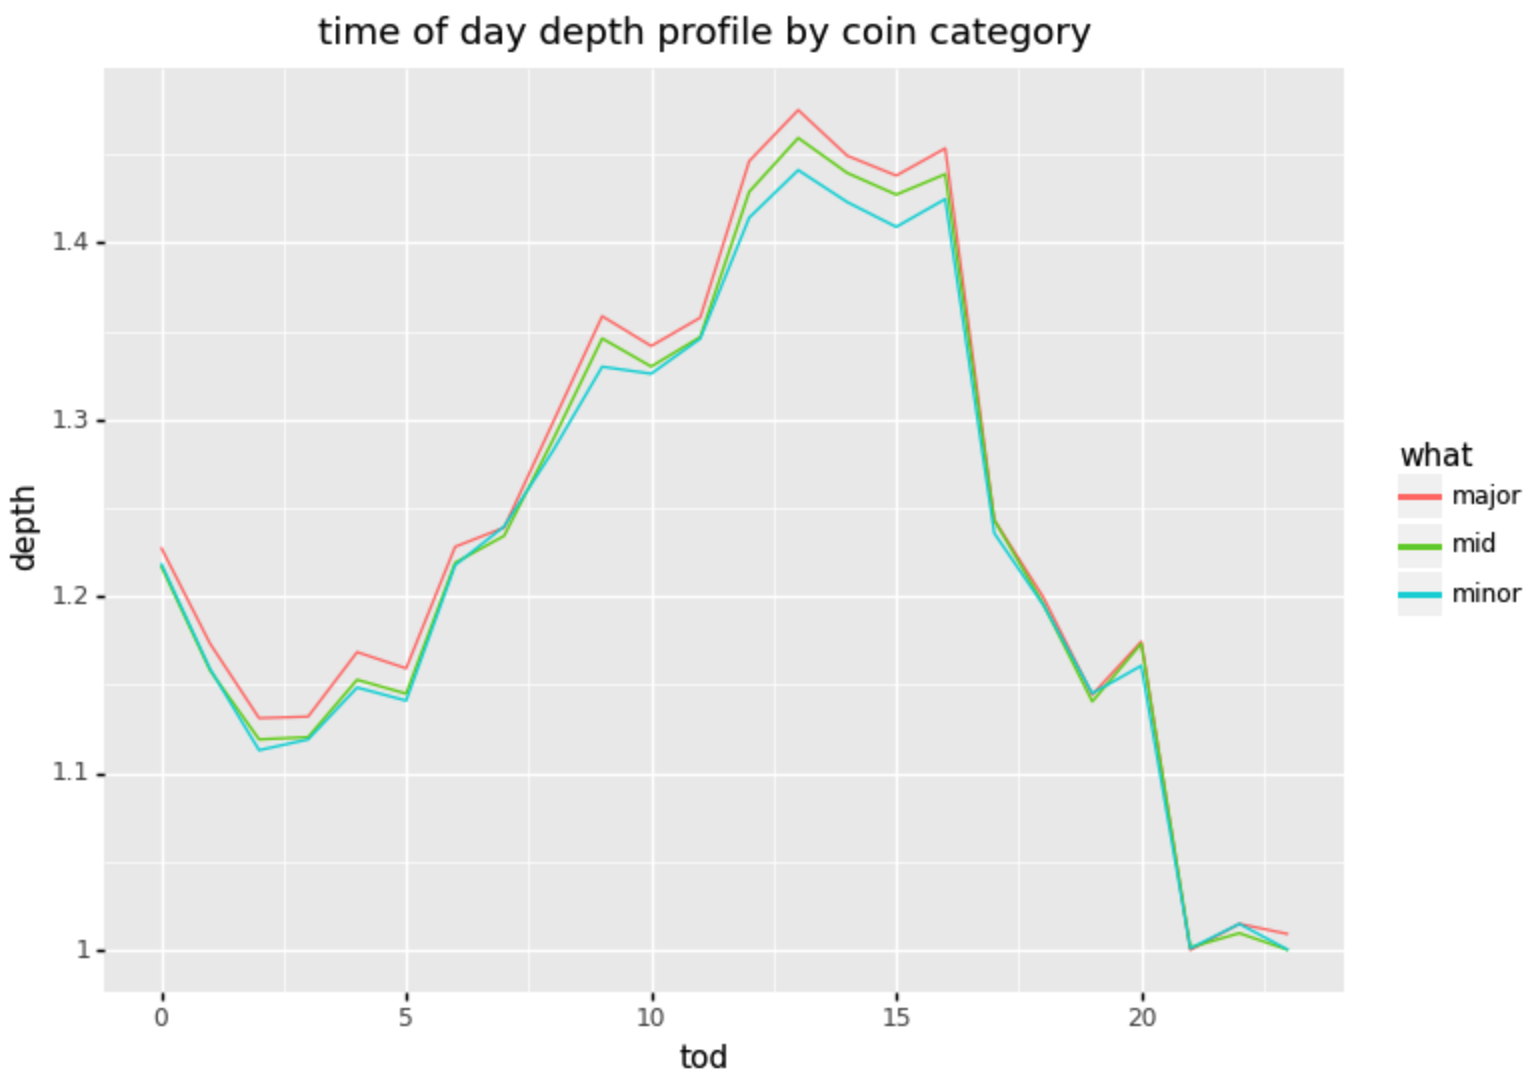
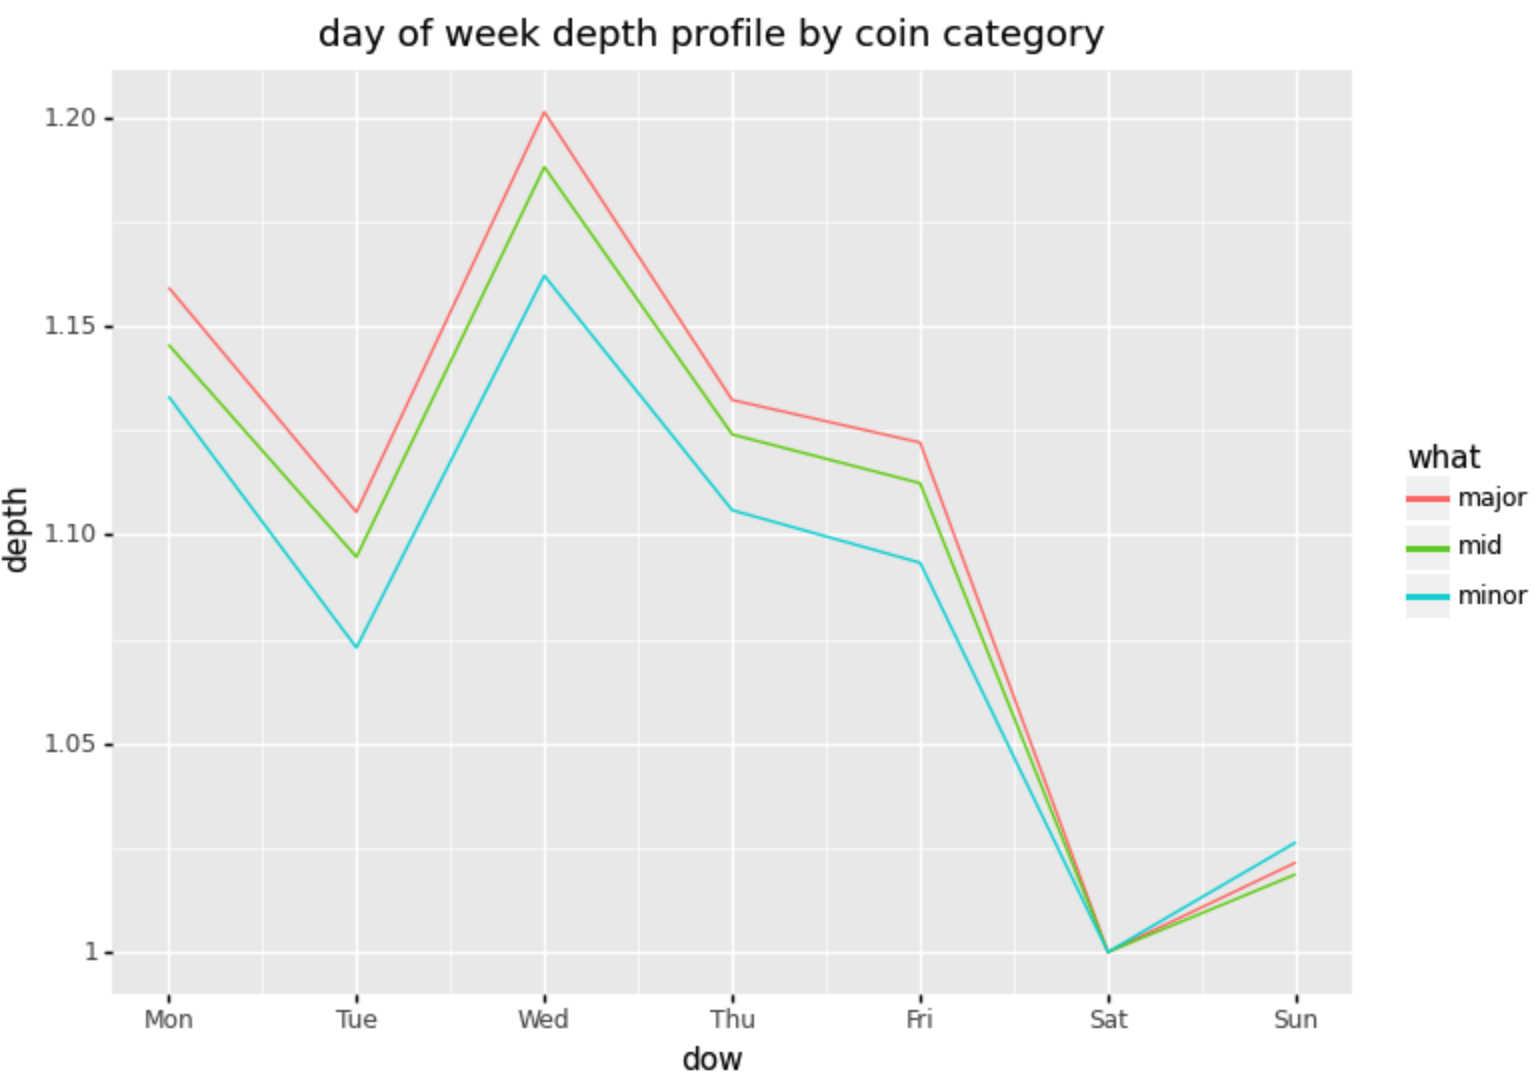
Time of Day and Day of Week
Dividing coins into the major (top 10% by volume), mid (above 50% < 90%), minor (< 50%), examining TOD and DOW patterns, to answer the following questions:
- Is there a substantial difference in TOD / DOW profiles between top and bottom coin groups (no)
- Is there a time-of-day effect (yes)
- Is there a day-of-week effect (yes)
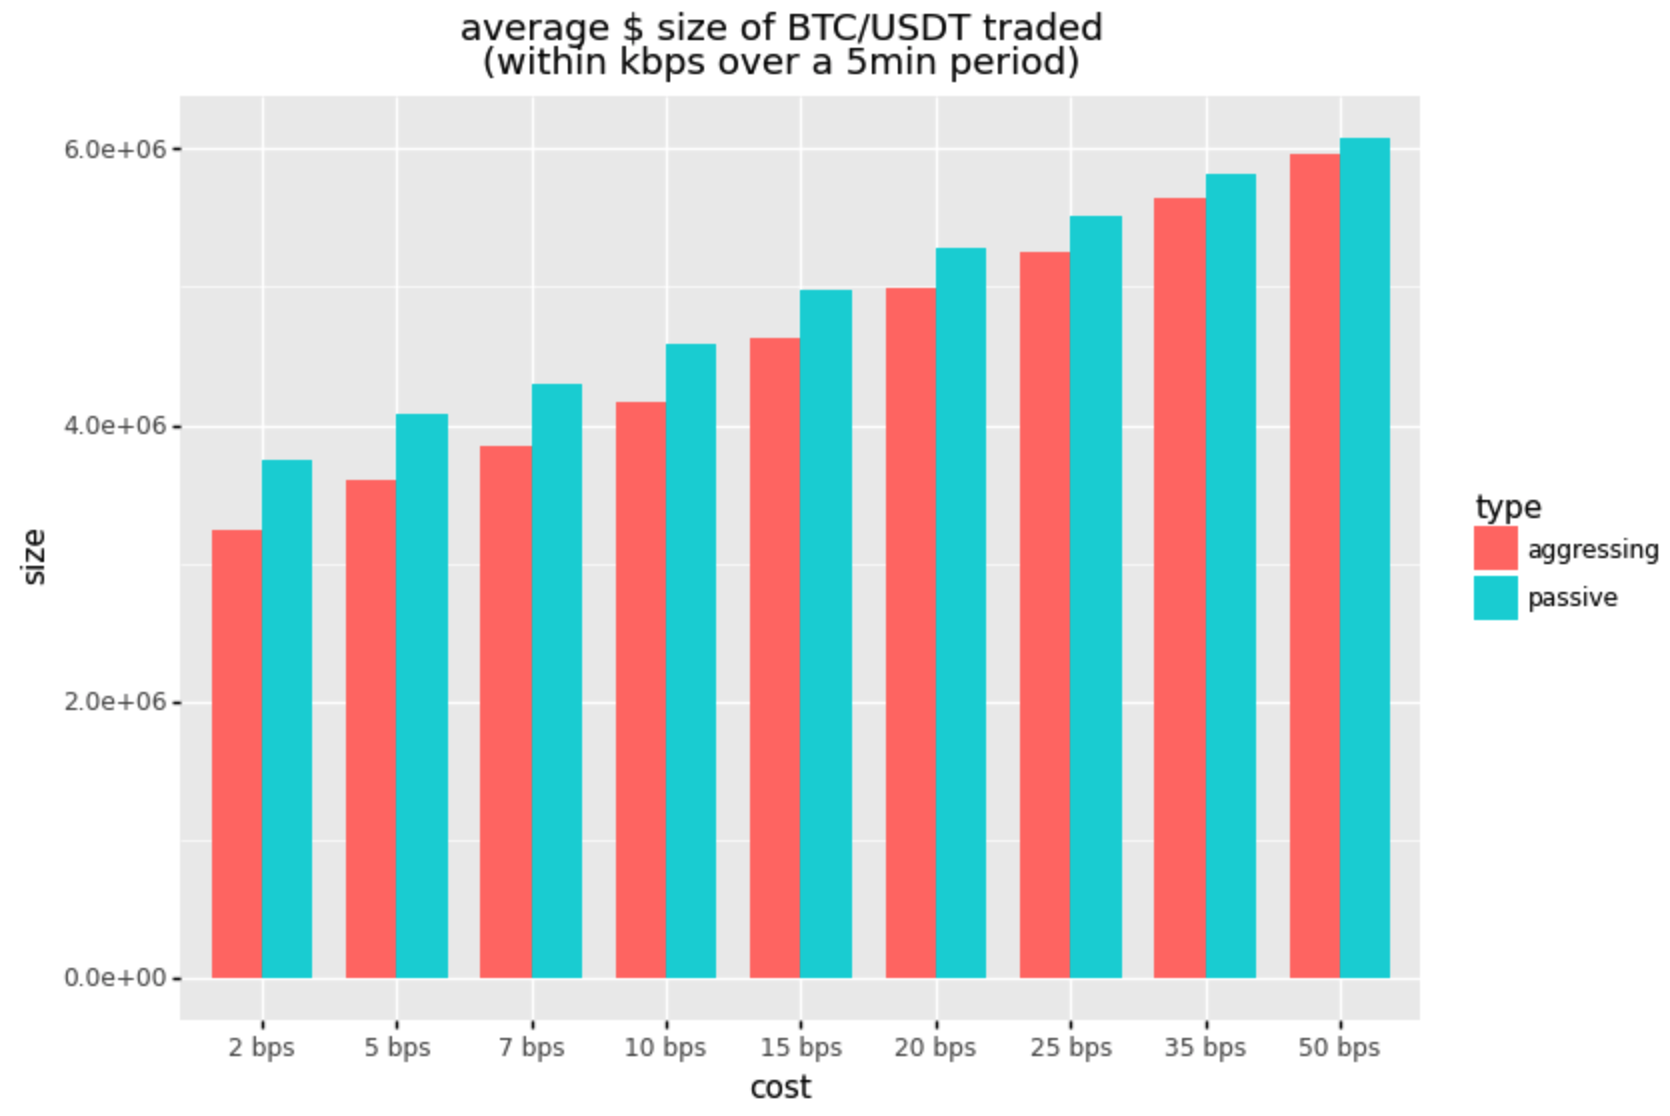
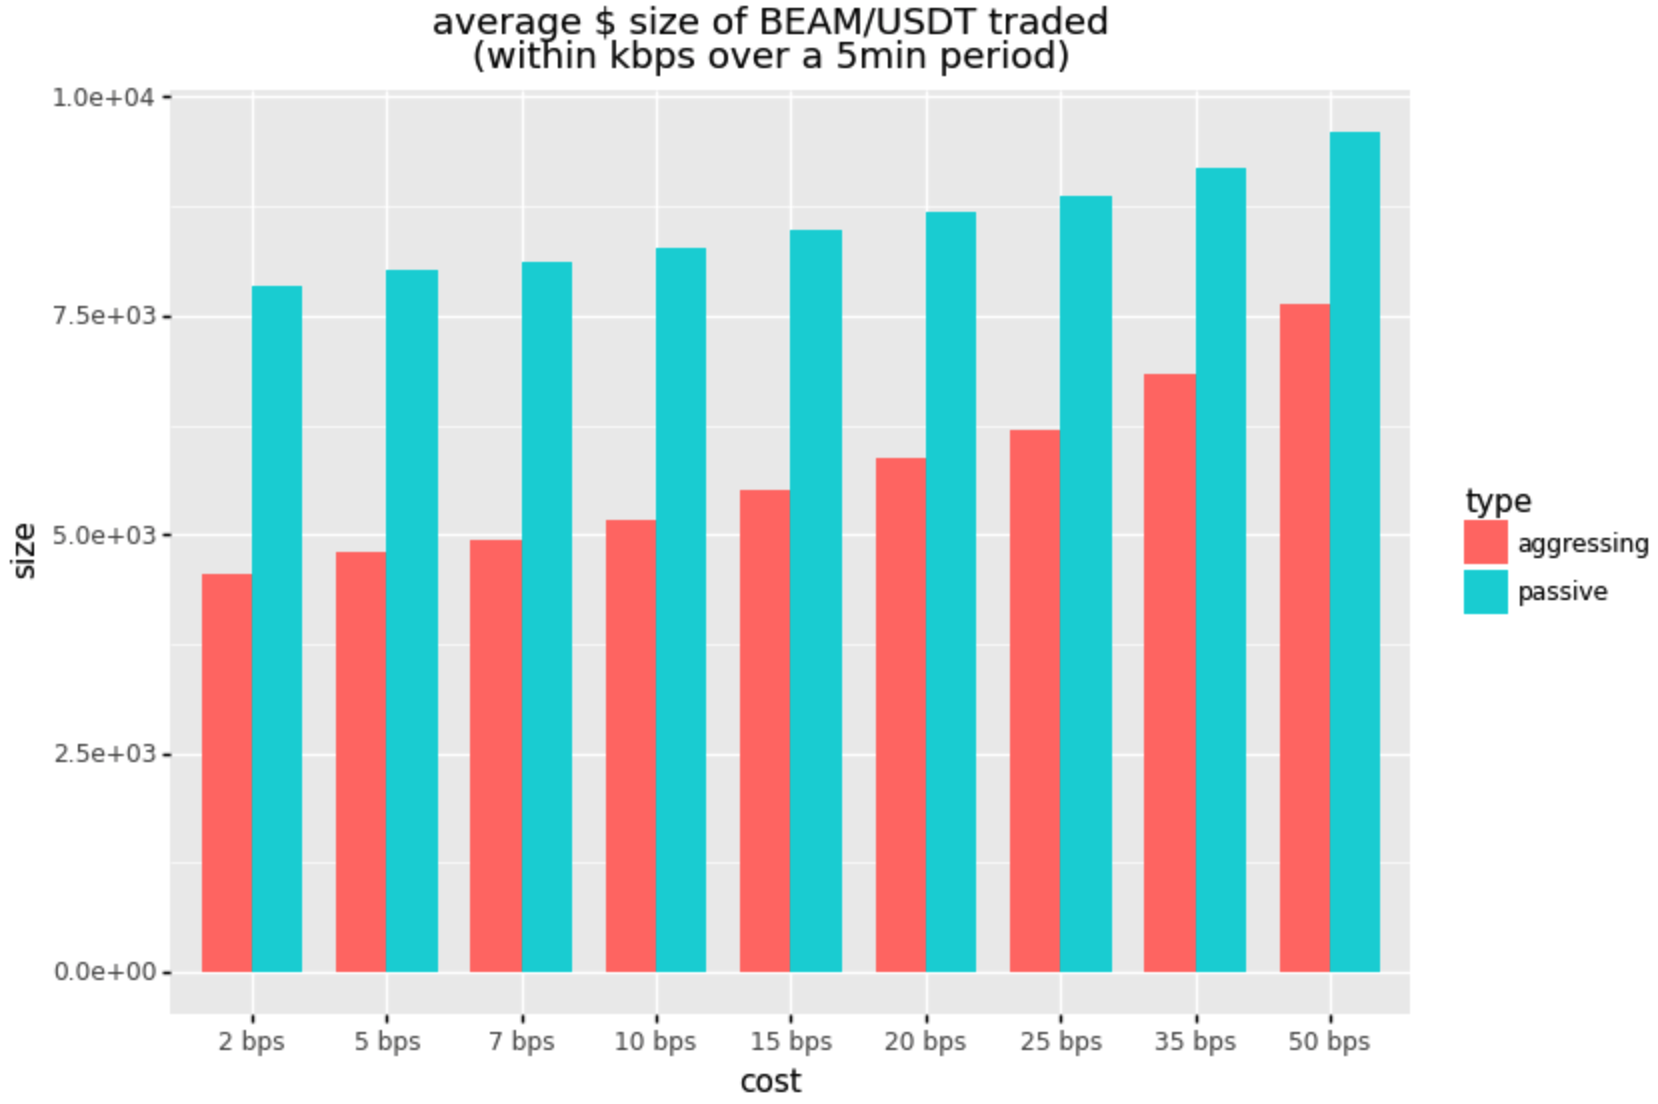
Size / Cost Distribution
I wanted to get a view of how much size is done (passively or aggressively) for a given direction over different time periods and for some cost (in terms of bps deviation from the reference price).
We can see a substantial difference in the amount of size traded within 5 minutes between BTC (in the top tier) and BEAM (bottom tier):
Size accumulation by time in market / cost basis
The size accumulated within 5min - 30min scaled linearly with the amount of time was in the market (for BTC/USDT):
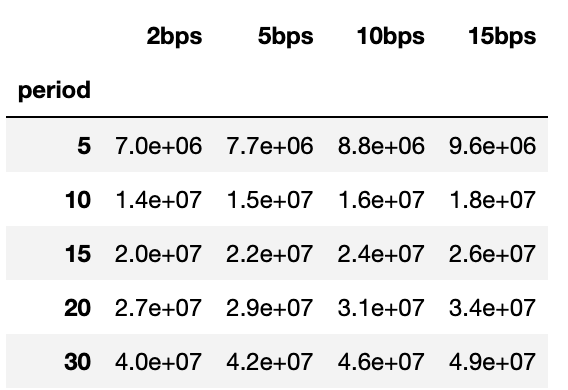
On average, the price hovered in the vicinity of the base price across the 5min - 30min period on average, such that the volume achieved within 2bps grew 1:1 in proportion to the amount of time in the market.
Size in the context of momentum
Using the momentum labeler, observed the amount of size done in upward, downward, and neutral momentum (here are the stats for BEAM/USDT, in the 2bps cost category):
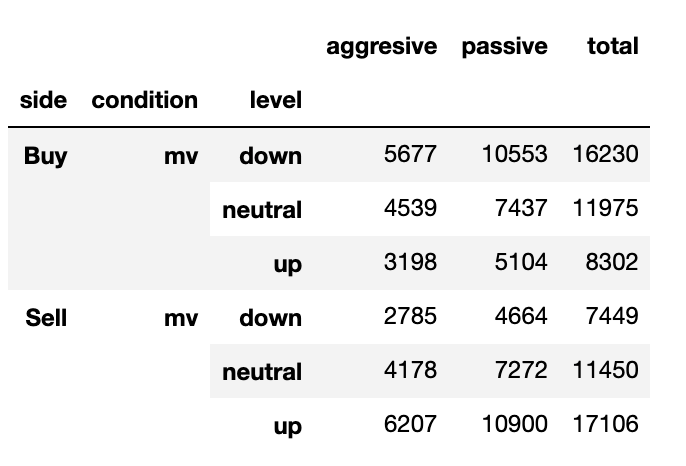
As expected, the results show:
- Chasing momentum results in, overall, lower size
- for example buying during upward momentum only accumulated 8k$ of size versus 11K$ neutral or 16K$ in downward momentum.
- Buying in downward momentum allows for more net accumulation
- needless to say, most size accumulated in this scenario can be passive
Size in the context of different volatility regimes
I divided volatility into low (<= 30% quantile), medium (30% < 70%), and high (> 70%) categories to see how this would affect liquidity (again BEAM/USDT, in the 2bps category):
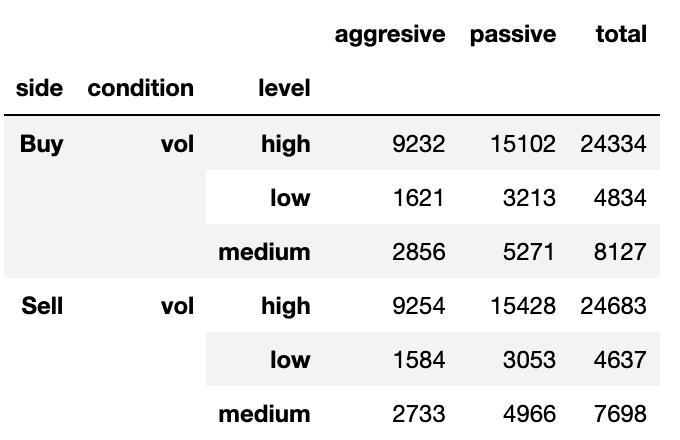
The results show that there is much more liquidity in higher volatility regimes in the bottom ranked coins. The effect is less pronounced in the top ranked coins.
Size By Coin (5mins)
Here is the average size seen over a 5min execution window by coin and cost bucket (on Binance):
| pair | 2bps | 5bps | 10bps | 15bps |
|---|---|---|---|---|
| BTC/USDT | 7.0e+06 | 7.8e+06 | 8.8e+06 | 9.7e+06 |
| ETH/USDT | 4.4e+06 | 4.7e+06 | 5.2e+06 | 5.7e+06 |
| BNB/USDT | 2.4e+06 | 2.6e+06 | 2.8e+06 | 3.0e+06 |
| XRP/USDT | 1.7e+06 | 1.8e+06 | 1.9e+06 | 2.1e+06 |
| ADA/USDT | 1.4e+06 | 1.4e+06 | 1.6e+06 | 1.7e+06 |
| DOT/USDT | 8.0e+05 | 8.5e+05 | 9.3e+05 | 9.9e+05 |
| MATIC/USDT | 7.6e+05 | 7.9e+05 | 8.4e+05 | 8.8e+05 |
| LTC/USDT | 5.6e+05 | 6.0e+05 | 6.6e+05 | 7.0e+05 |
| ETC/USDT | 5.1e+05 | 5.3e+05 | 5.6e+05 | 5.9e+05 |
| EOS/USDT | 5.0e+05 | 5.3e+05 | 5.7e+05 | 6.1e+05 |
| VET/USDT | 4.9e+05 | 5.1e+05 | 5.5e+05 | 5.8e+05 |
| CHZ/USDT | 4.9e+05 | 5.1e+05 | 5.4e+05 | 5.7e+05 |
| LINK/USDT | 4.4e+05 | 4.7e+05 | 5.1e+05 | 5.5e+05 |
| … | … | … | … | … |
| BEAM/USDT | 1.2e+04 | 1.3e+04 | 1.3e+04 | 1.4e+04 |
| WAN/USDT | 1.2e+04 | 1.2e+04 | 1.3e+04 | 1.3e+04 |
| KMD/USDT | 1.1e+04 | 1.1e+04 | 1.2e+04 | 1.3e+04 |
| NMR/USDT | 1.1e+04 | 1.1e+04 | 1.2e+04 | 1.2e+04 |
| TROY/USDT | 1.0e+04 | 1.1e+04 | 1.1e+04 | 1.2e+04 |
| REP/USDT | 1.0e+04 | 1.0e+04 | 1.1e+04 | 1.2e+04 |
For those interested, happy to share the larger generated data set containing distribution by: pair, side, dow, tod, period, condition & level.
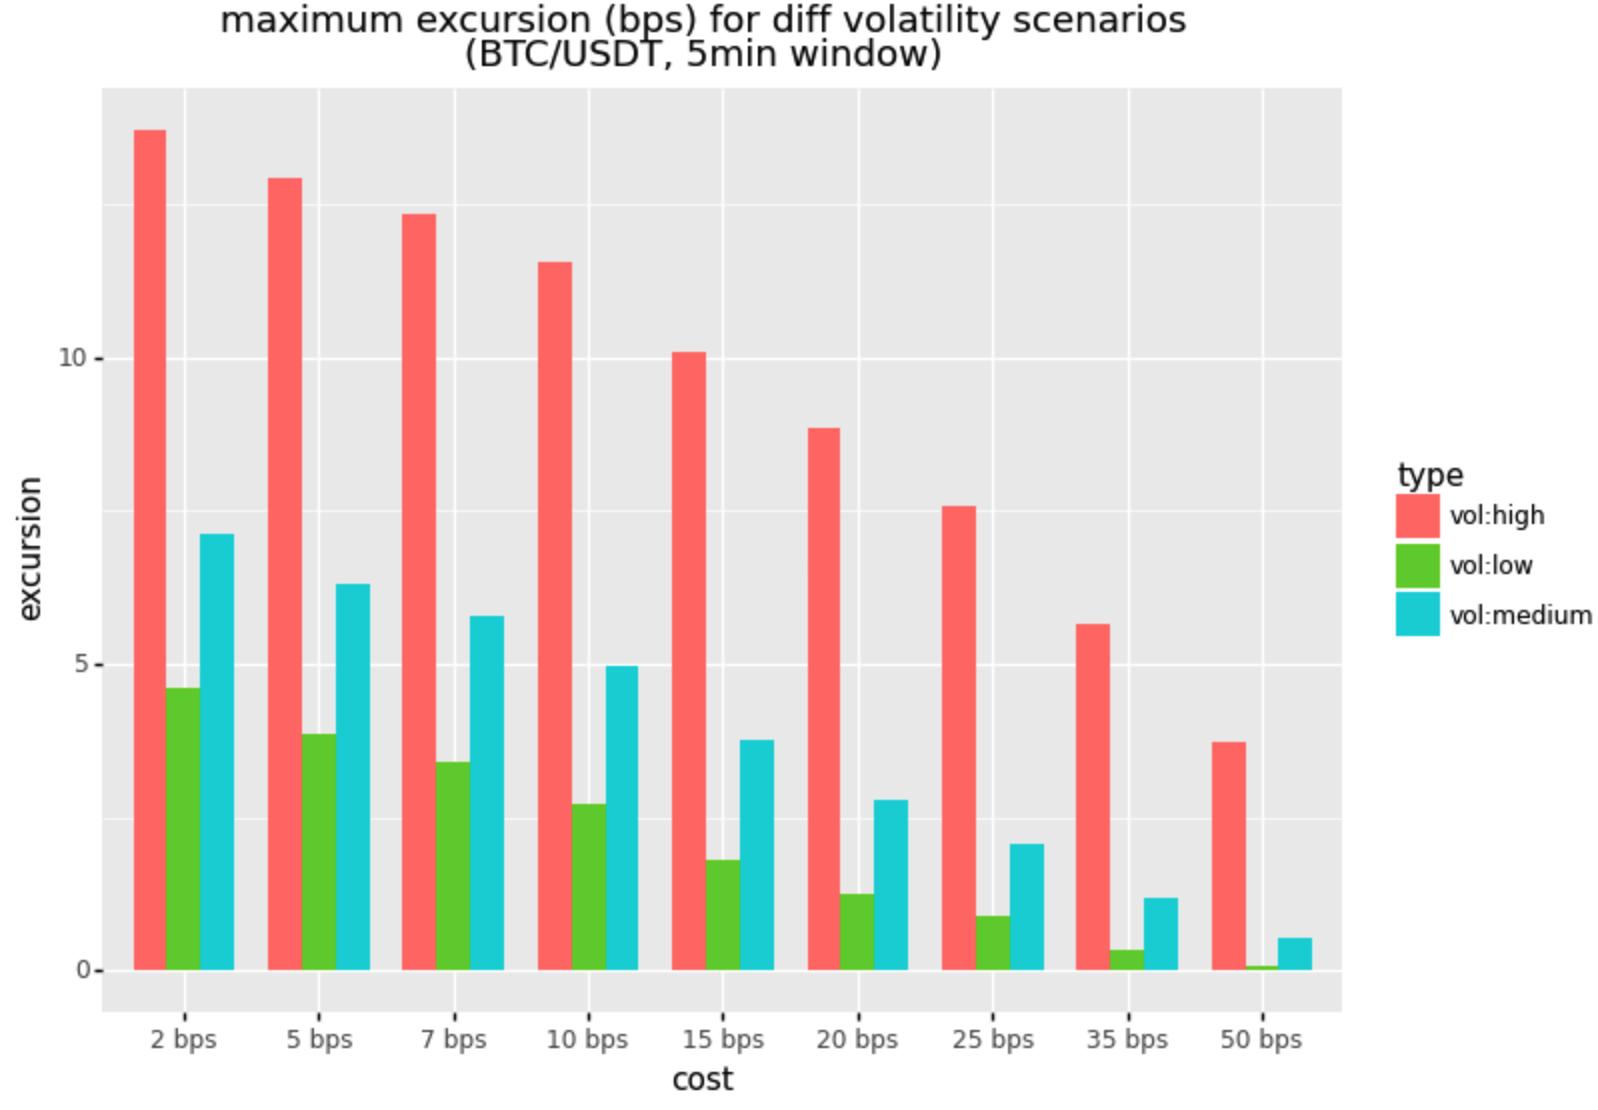
Excursions
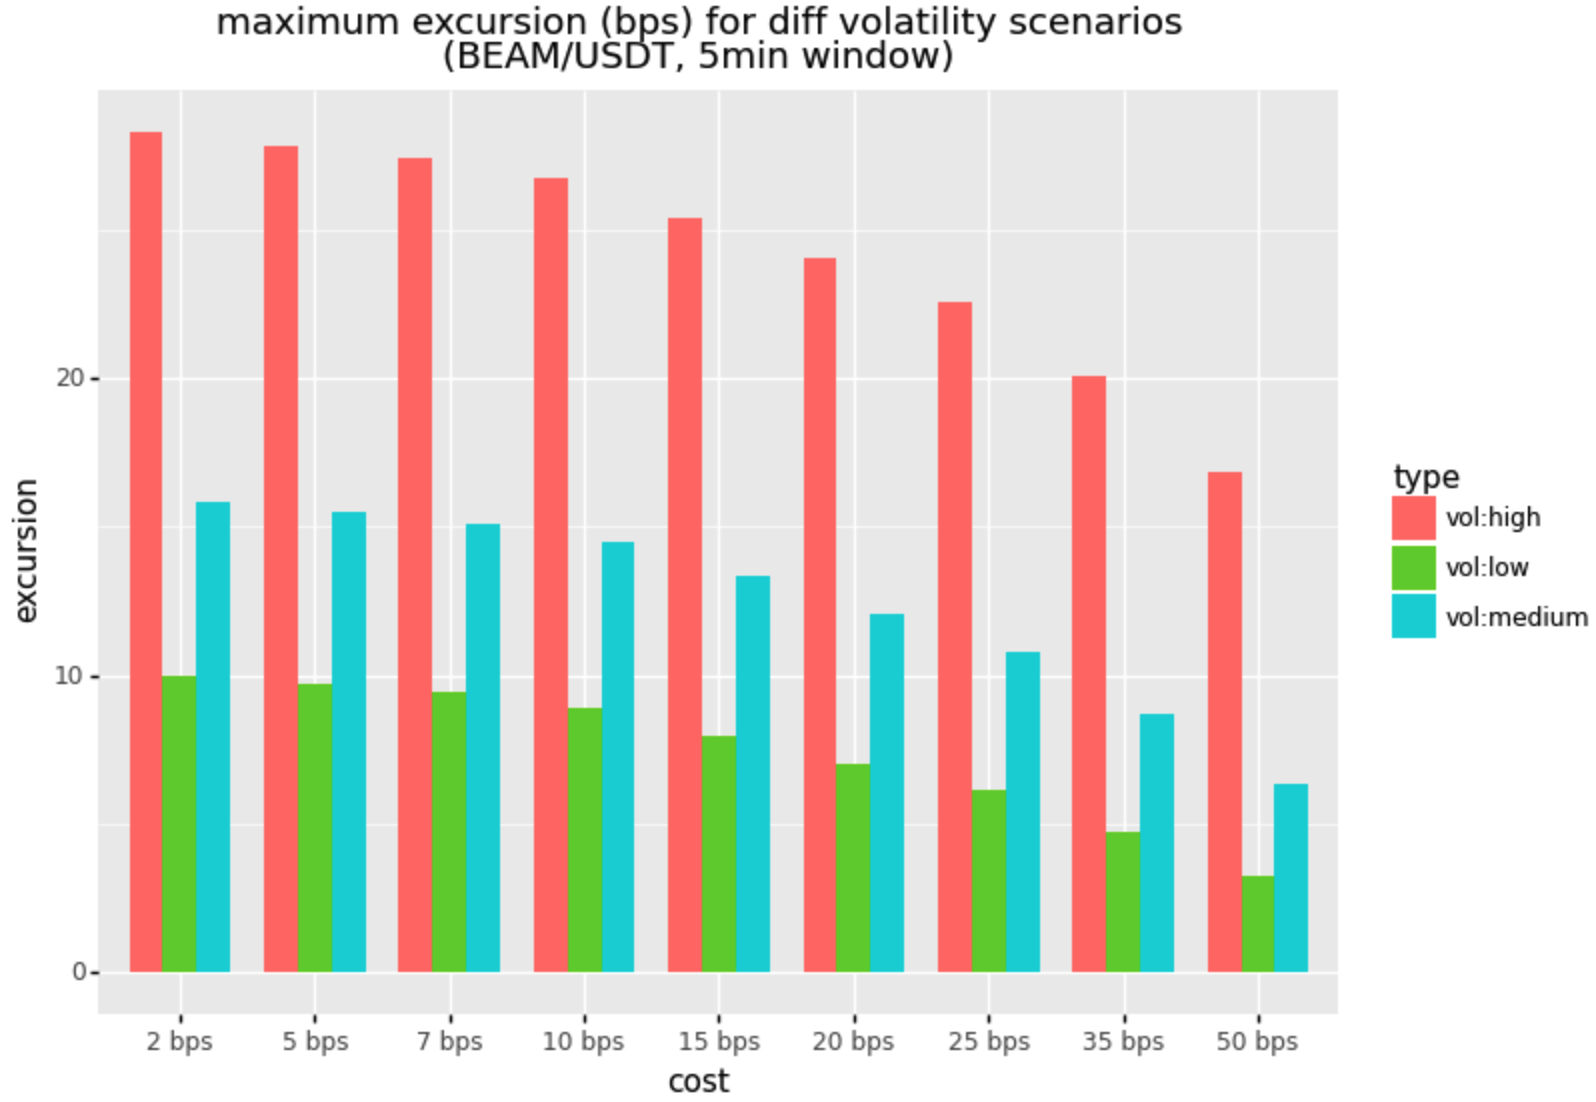
The assumption in this size analysis is that we are executing (passively or aggressively) during some fixed period and targetting some maximum entry cost (for example 2bps). The price will undoubtedly drift outside of our target cost region during the execution period, particularly if is a longer period or in the context of volatility or momentum.
Hence was interested to know what the average maximum excursion (in bps) was for a given cost target. For coins like BEAM, this could be rather large depending on volatility context:
Conclusions & Notes
- time-of-day is material, with a 45% impact in terms of addressable volume
- day-of-week variation is fairly marginal, with a 10% degradation over the weekend
- addressable size in the top pairs is quite substantial, and in the bottom pairs quite marginal
- some coins trade on multiple exchanges, increasing addressable size
I am not yet trading the referenced strategies, as need to set up an offshore entity or partner with a 3rd party. Also, still have some more work to do in terms of portfolio sizing and blending, but otherwise look very attractive.