Analyst Ratings → Return Prediction
I have a couple of equities strategies that I will start trading shortly, and I want to understand the risk from all angles. Towards this end I try to utilize both market signals and exogenous unstructured data to minimize surprise and maximize selection or prediction efficiency. In thinking about single name risks (i.e. the risk associated with selecting and trading a particular stock), I wanted to examine is if there is any signal or risk measure I could derive from analyst ratings.
Analysts at banks and other financial institutions rate stocks that they cover, loosely according to the following scheme:
| Category | Score | Alternative names |
|---|---|---|
| Buy | +2 | Strong Buy, Conviction Buy, Top Pick, … |
| Outperform | +1 | Sector Outperform, Speculative Buy, Overweight, … |
| Hold | 0 | Sector Perform, Neutral, Sector Weight, … |
| Underperform | -1 | Market Underperform, Sector Underperform, … |
| Sell | -2 | Strong Sell, Reduce, Trim, … |
In evaluating the top 2000 stocks I encountered 44 different rating names, for which mapped into the above 5 level scoring scheme.
Sourcing the Data
Yahoo Finance provides a timeseries of ratings via its JSON api. Conveniently, the python yfinance package
already has implemented this functionality:
import yfinance as yf

# get reference to all Apple data (historical bars, ratings, financials, ...)
aapl = yf.Ticker("AAPL")
# pull ratings data
aapl.recommendations
The Plan
Given a timeseries of analyst ratings, I want to relate these to returns on various forward windows. It would make sense to try to predict the sign of forward returns rather than the sign+magnitude (which would be nearly impossible to predict). One could use Logistic Regression if targeting binary labels (+1, -1) or one of the multi-class classifiers, such as Random Forest.
As we are often concerned with the relative performance of a stock as compared to either market or sector, can measure the returns in the following different ways:
- relative to sector: stock return - sector ETF return
- relative to market: stock return - market return (S&P 500)
- absolute return: raw stock return
As for features we could create a number of different features:
- rating for each individual analyst (firm)
- mean rating across analysts
- moving average of ratings across analysts
- prior returns
- derivatives of all of the above
Using a L1 loss function (or the Gini importance in the case of RandomForest) would tend to deselect features (and analysts) that don’t lead to accurate forward predictions.
Some Initial Analysis
Before doing the above analysis, wanted to make sure that the ratings data could pass a first round of scrutiny (“eyeballing” it). I purposely chose stocks showing underperformance or outright negative returns, to see how analysts did in these scenarios.
GE
GE has been in decline since 2017, so is a good test of negative sentiment. While there were some analysts with sell ratings, on average analysts where rating GE at neutral (0) to overperform (1) in the 2017 - 2019 period, whereas an “oracle” would have indicated a “sell” (-2). Analysts are often reluctant to indicate a sell as may impact their business with the company in question (a conflict of interest).
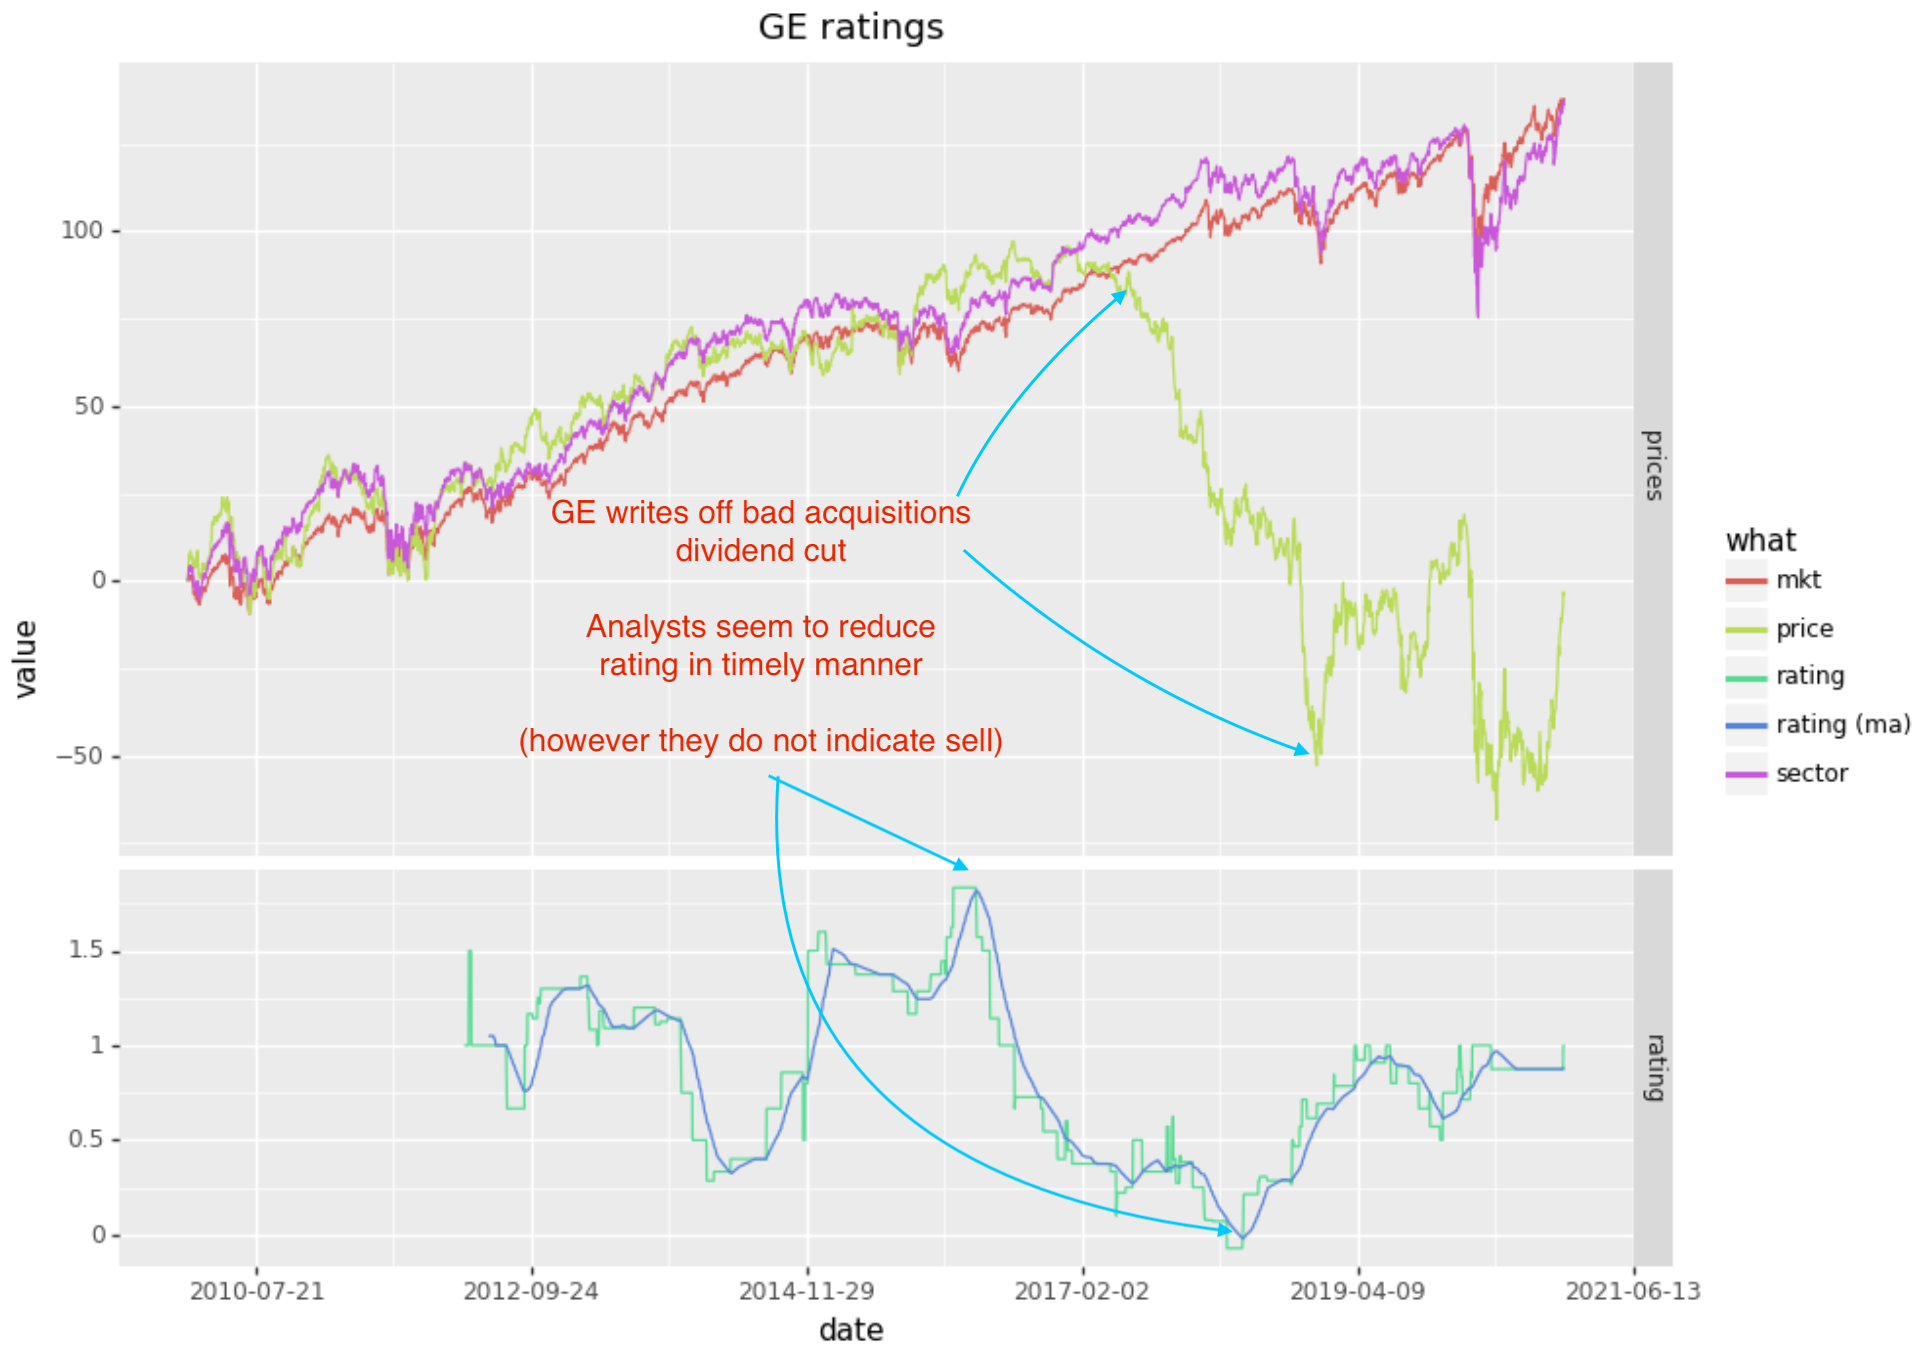
In the case of GE, it does seem like analysts reduced their rating ahead of a big move downwards and adjust upward at the end of the large move (so in this particular circumstance it seems like a successful change in consensus). However I would have liked to see this go into negative territory, at least to -1.
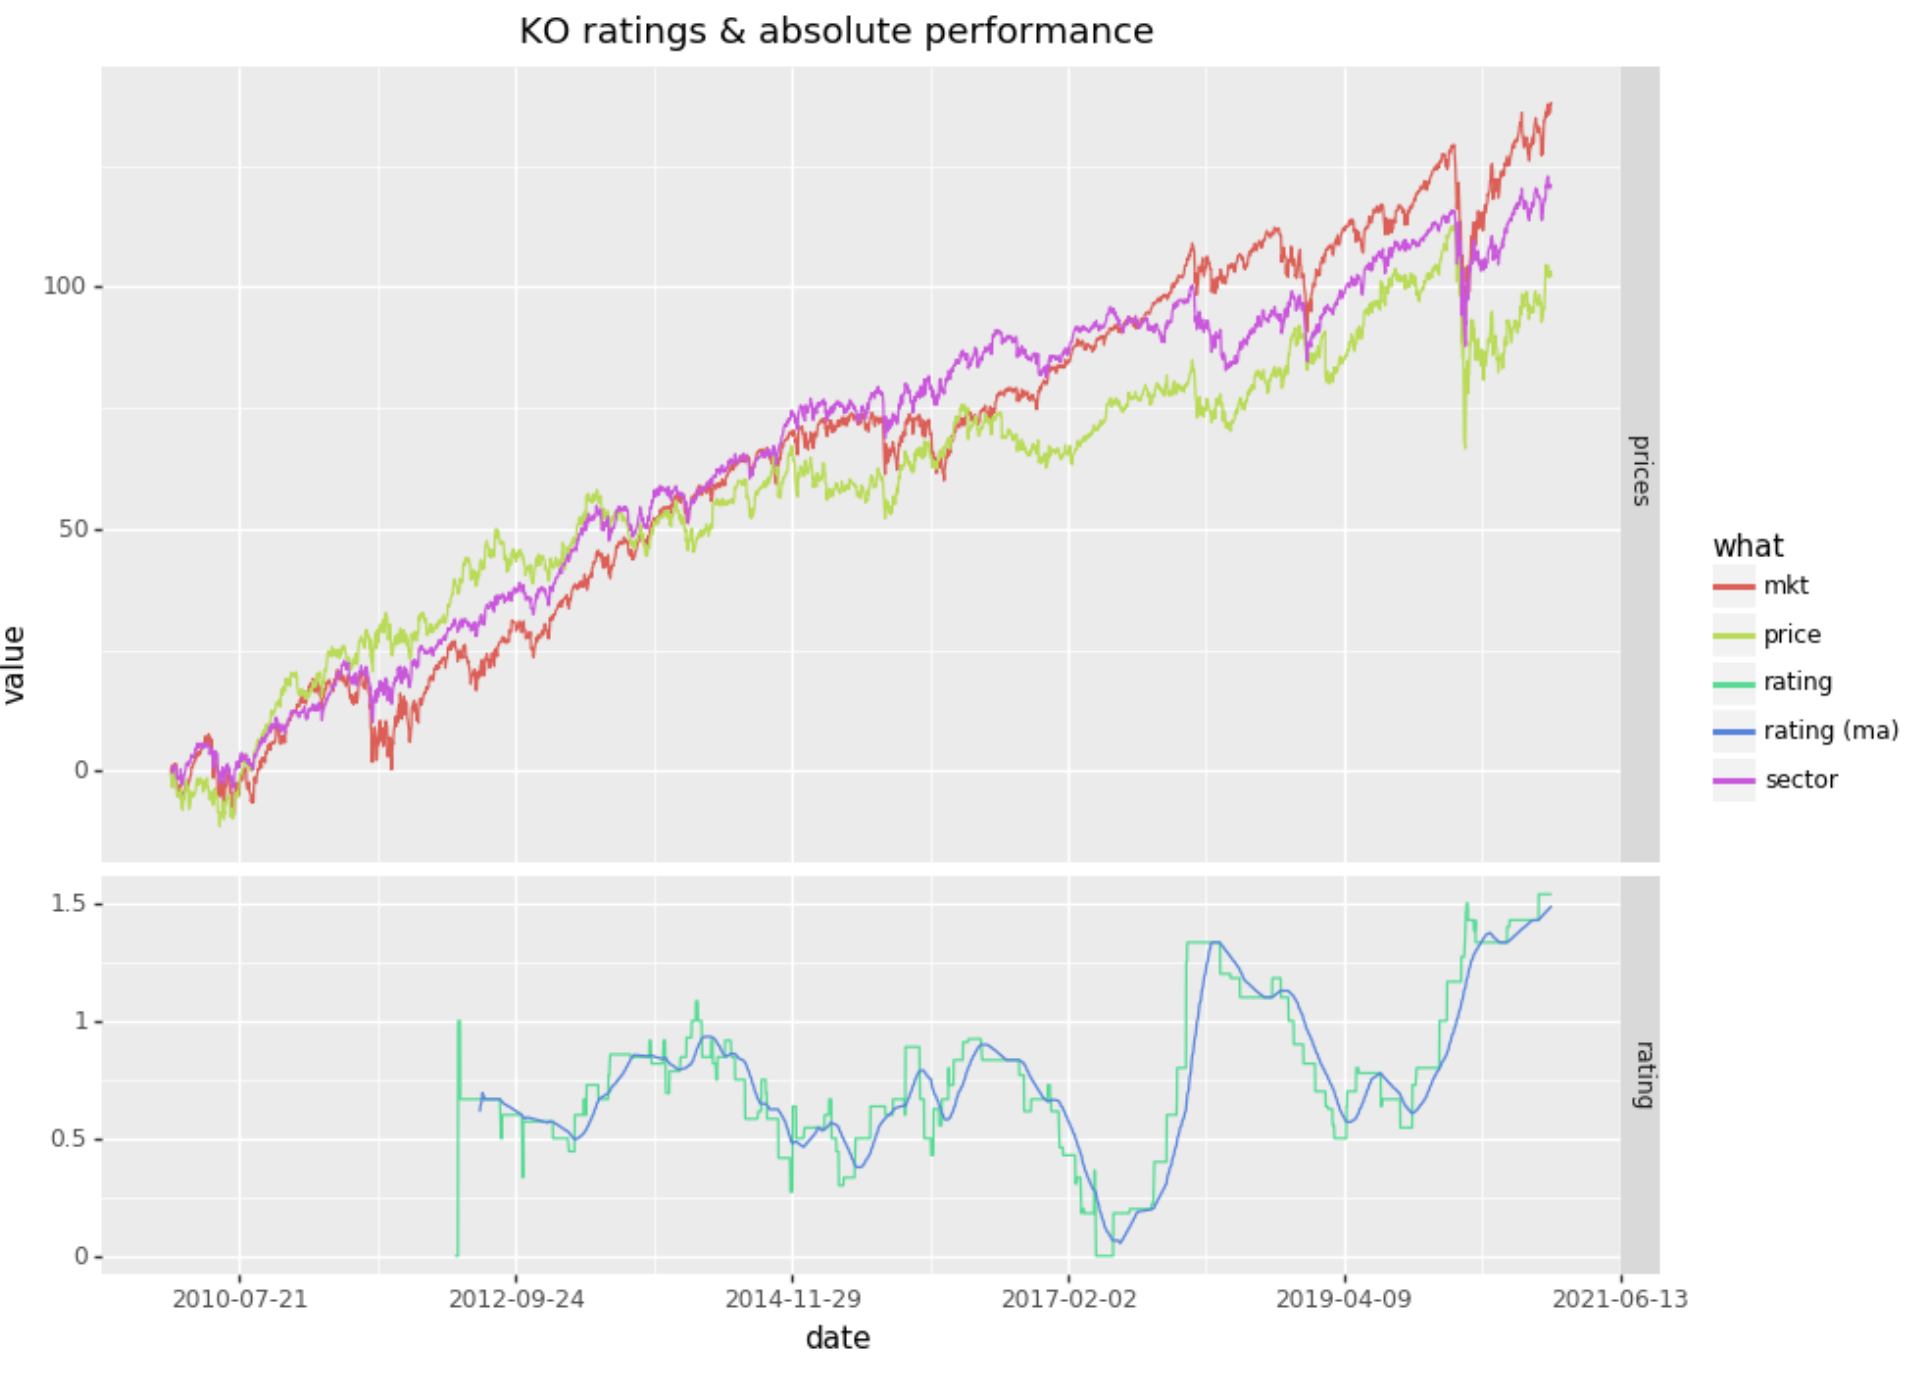
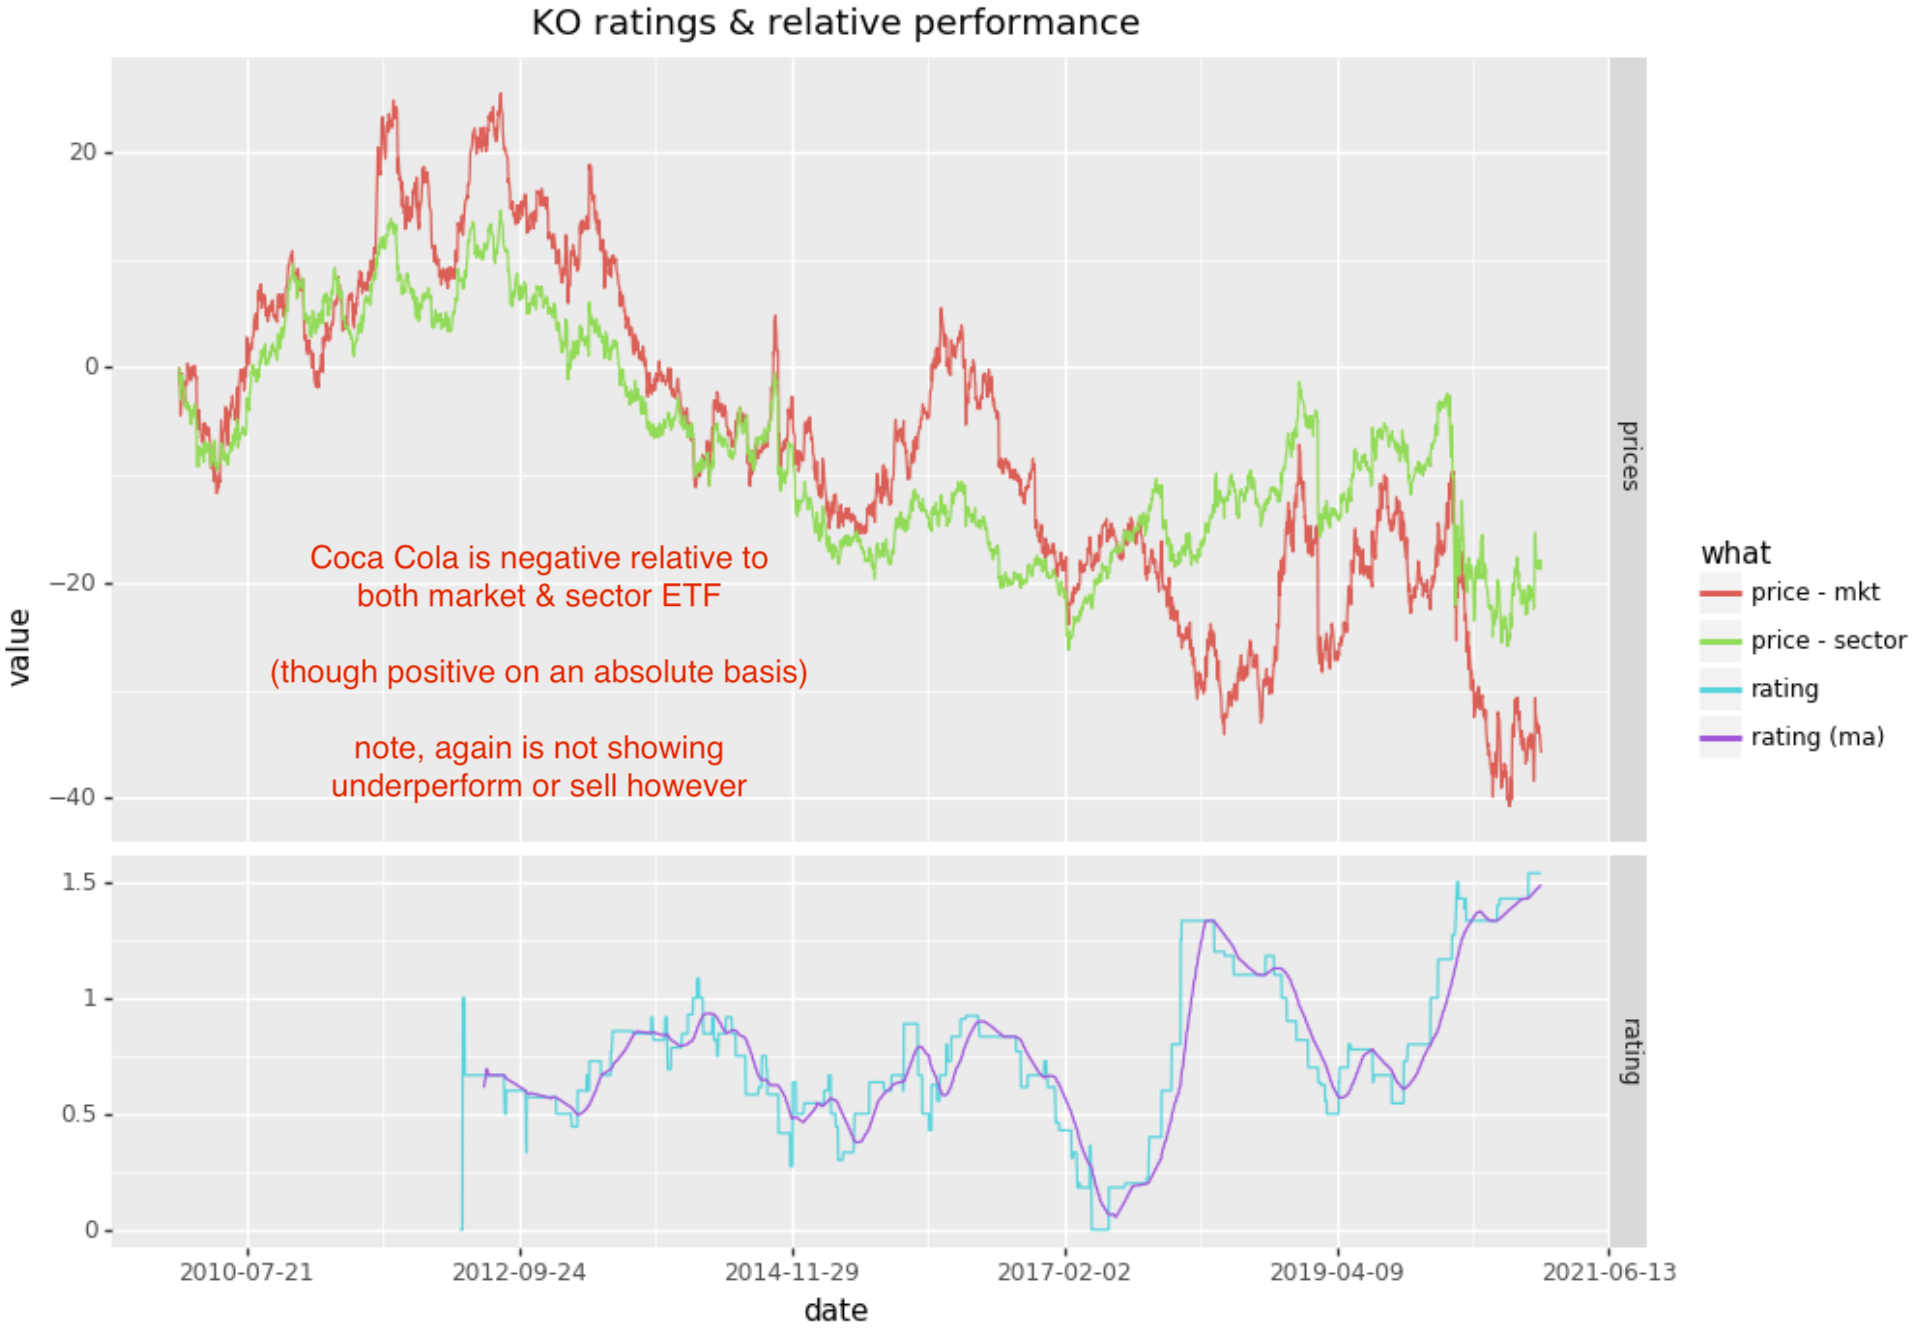
Coca Cola
Coca Cola is progressing upwards over the 10 year period, however is underperforming both the market and its sector. Below are the graphs of absolute returns and relative returns:
Analysis
Created the following features (as a timeseries matrix)
- individual firm rating (in numeric form: -2 to +2)
- seen as features: “Wells Fargo”, “Pacific Crest”, …
- mean combined rating
- seen as feature: combined
- MA of combined score on different EWMA windows (20, 50, 100 days)
- seen as features: score20, score50, score100
- derivative of score MAs:
- seen as features: df20, df50, df100
- relative prior returns (relative to sector ETF) on 10 - 200 days
- seen as features: relr10, relr10, … relr200
- absolute prior returns on 10 - 200 days
- seen as features: absr10, absr10, … absr200
The labels targeted a 22 day (approx 1mo) forward return. I tried all of the following variations:
- 3 labels: assigned as 0 if return < 2%, and -1 or +1 if magnitude above 2%
- 3 labels: volatility adjusted thresholds for +1 and -1, 0 otherwise
- 2 labels: assigned based on positive or negative
- 2 labels: +1 for large outlier + returns
- 2 labels: +1 for large outlier - returns
Feature Importance
Apply an iterative Random Forest Feature Importance algorithm, determined the following feature importance for AAPL:
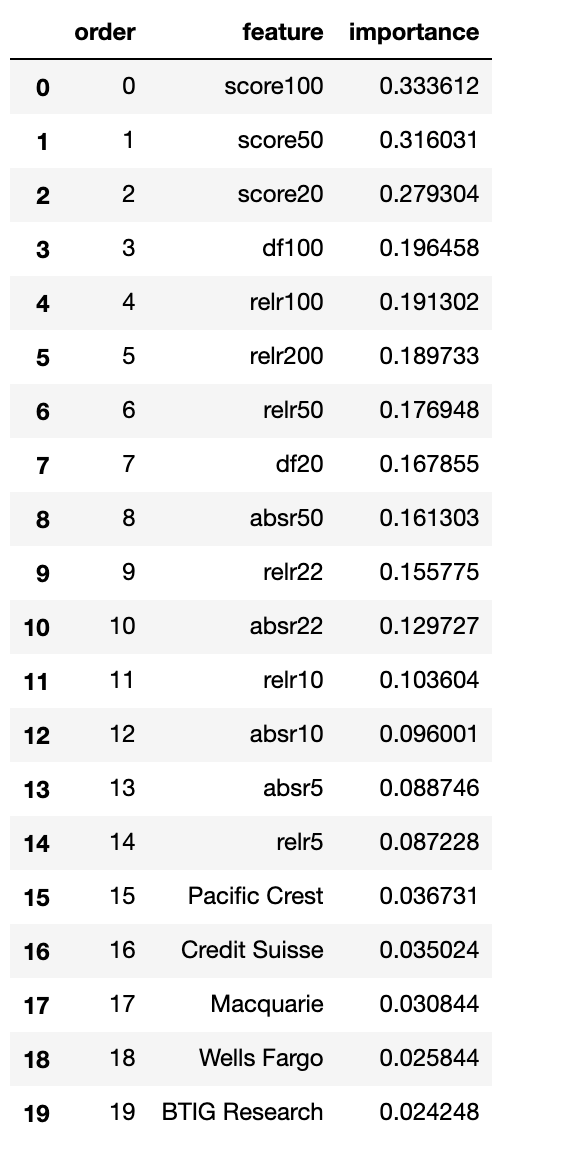
Running variable importance on other stocks (such as KO, MSFT, BBY, …) saw very similar importance ranking. It seems that no one analyst (firm) is particularly accurate. However the moving average of the combined scores seems to have relevance for forward returns.
The good news is that the combined analyst rankings are more relevant than prior returns for predicting forward return. This points to more information in the ensemble of analysts, than is present in the prior returns.
Classification On Individual Stocks
We have 2 significant problems in running a classification on daily equity data:
- limited # of samples
- the yahoo analyst rating data begins in mid 2012, so only allows us 8 years of data or (2140 rows in our case)
- equities have had a long bias, reducing the # of negative returns to sample
- this is somewhat mitigated by evaluating against relative returns
Running the above features against relative returns for AAPL for example led to this sort of out-of-sample confusion matrix:
| / | Positive | Negative | Accuracy |
|---|---|---|---|
| Positive | 44 | 6 | 88% |
| Negative | 340 | 110 | 25% |
This is not a good result as is, on average, only slightly better than random. I achieved even worse confusion matrices on other stocks (such as GE). I suspect the problem is that I am training (and testing) on too few samples.
Classification Across Stocks
I generated features and labels for all S&P 500 stocks, combining them together to generate a large data set. This produced a result with better accuracy:
| / | Positive | Negative | Accuracy |
|---|---|---|---|
| Positive | 92040 | 58150 | 61% |
| Negative | 13991 | 40938 | 75% |
Removing the market features and only retaining the analyst ratings only reduces the accuracy slightly:
| / | Positive | Negative | Accuracy |
|---|---|---|---|
| Positive | 87082 | 56956 | 60% |
| Negative | 18949 | 42132 | 69% |
I also evaluated on S&P 500 stocks in the GICS Technology sector; training within a sector resulted in very high accuracy; I suspect that analysts that cover particular sectors will have specific patterns of behavior in terms of how they rank, distinct from other sectors:
| / | Positive | Negative | Accuracy |
|---|---|---|---|
| Positive | 13932 | 5006 | 74% |
| Negative | 800 | 7129 | 90% |
Next Steps
When I revisit this will look at:
- training on equities within the same industry and other groupings
- evaluating the accuracy of each equity against the cross-trained model
- potentially drop the lowest accuracy analysts to build a better combined score
- adding various market signals to improve accuracy
Addendum
Note that the above analysis overstates analyst accuracy in that it allows analysts to adjust their rating after a stock has started a downward (upward) move. The approach I took with the analysis was to evaluate the forward 20 day return for each day relative to the combined analyst score. Here is a scenario that would show lag in analysts predictions but still allow them to achieve a high score in the above analysis:
- analysts combined score shows a buy
- stock drops significantly over the course of a week
- analysts adjust to lower score (sell or underweight)
- stock continues to drop for the next couple of months
Only 1 week out of 9 weeks would show bad accuracy in the above scenario. Meanwhile, you might have purchased the stock at the beginning of week 1 based on analyst’s positive scoring.