Bitcoin Mempool & Momentum
I have been thinking about the recent institutional buying that has propelled the price of bitcoin to stratospheric levels; in particular considering how one might detect some of this interest early. Bitcoin and crypto, in general, is quite interesting in that due to the decentralized ledger, there is more transparency in this market than any other financial market.
The majority of transactions, at this point, occur off chain on exchanges. However, if one wanted to buy into a large position, would first try to locate blocks (large size) in the OTC market. Miners, for example, tend to be natural sellers, as accumulate long positions and need to offload at least some of this position to fund operations. By locating coin in the OTC market can potentially get into a portion of the position with minimal impact on lit markets (exchanges).
The hypothesis, then, is that the market will first show signal in terms of # or size of transactions on the chain before it manifests in terms of price. Big buyers will resort to the exchange once they have exhausted OTC opportunities. Once exchange buying commences, the price will accelerate.
Bitcoin nodes have the notion of “mempool”, which is basically a cache of pending transactions. This pool can be sampled periodically to get a sense of # of transactions pending, # of transactions by fee level, etc.
Observations
I pulled in 3 years of mempool pending transaction data (with ~2 observations per day, though would have prefered more granular sampling). The raw data looked like this:
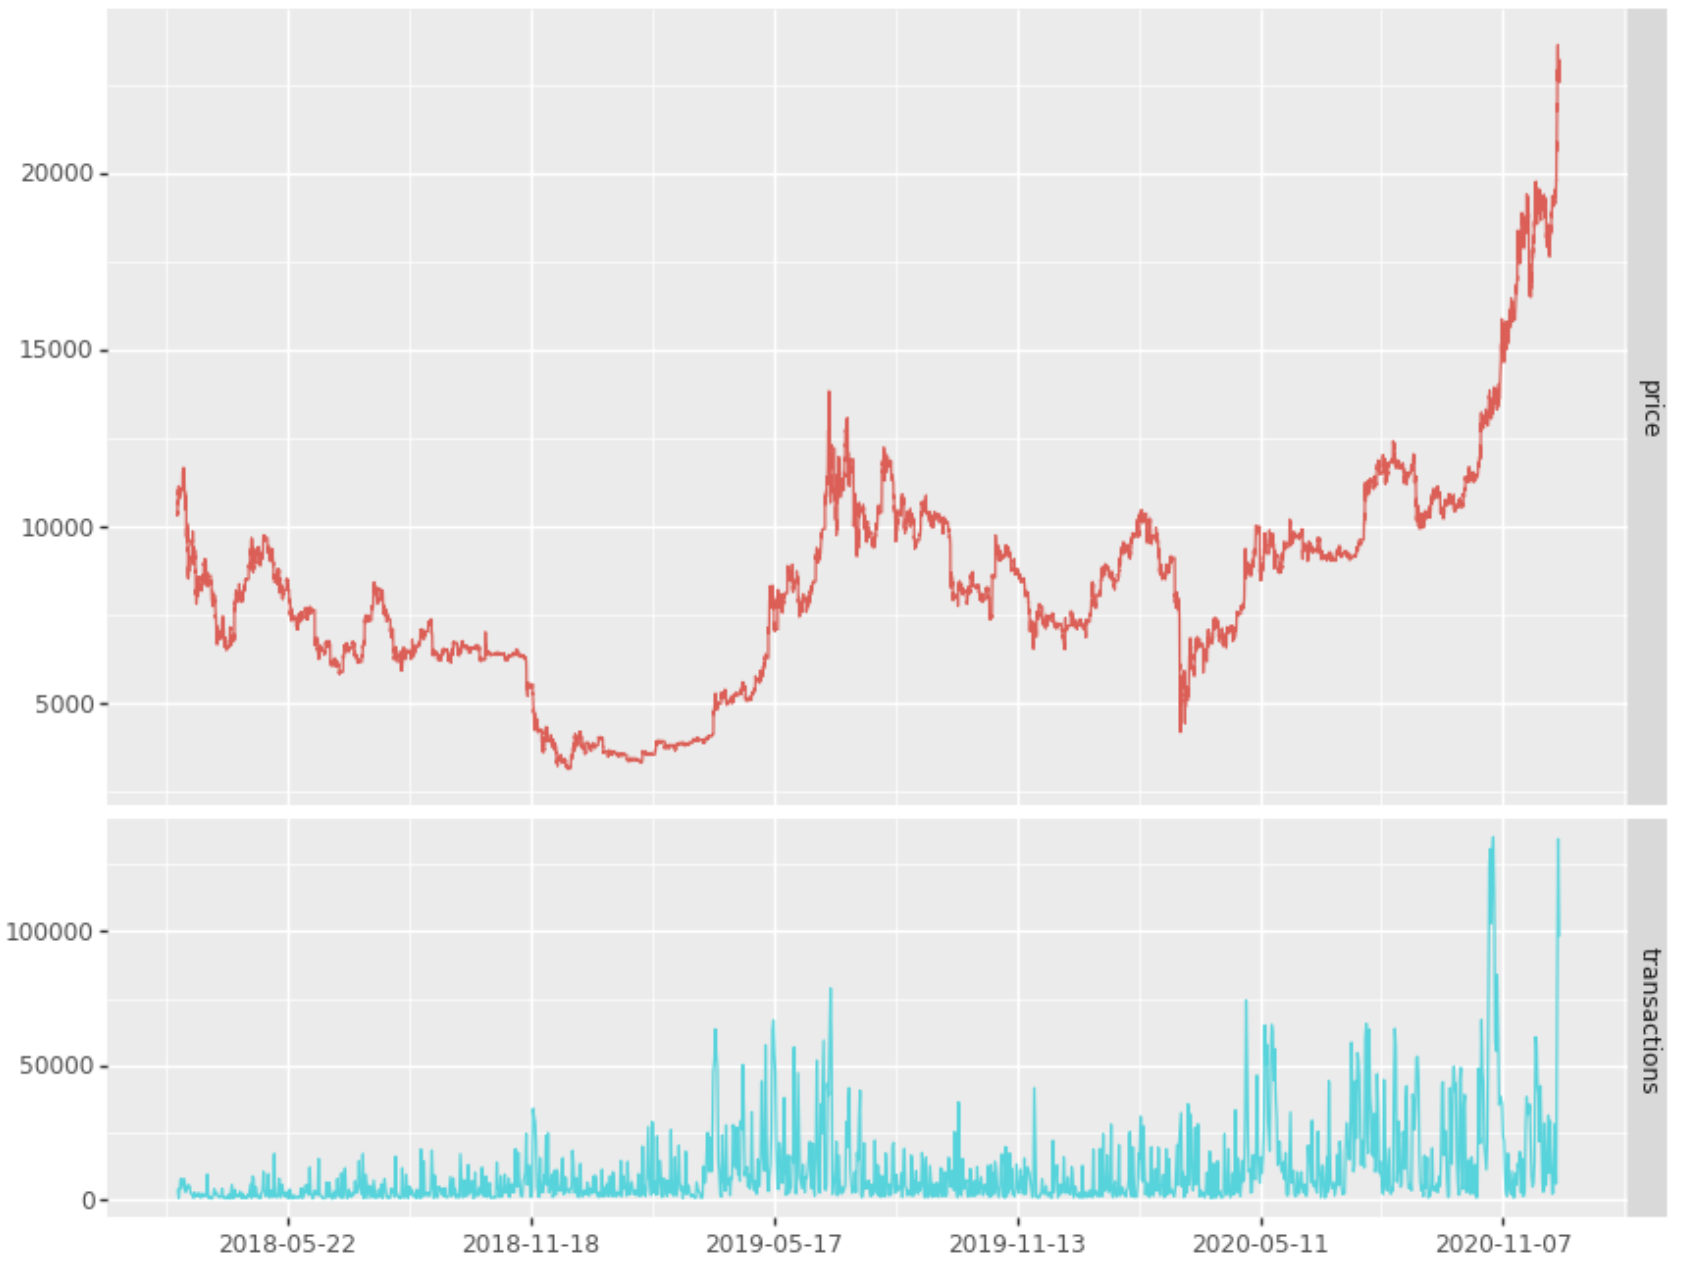
Rescaling the data and applying a hawkes process:
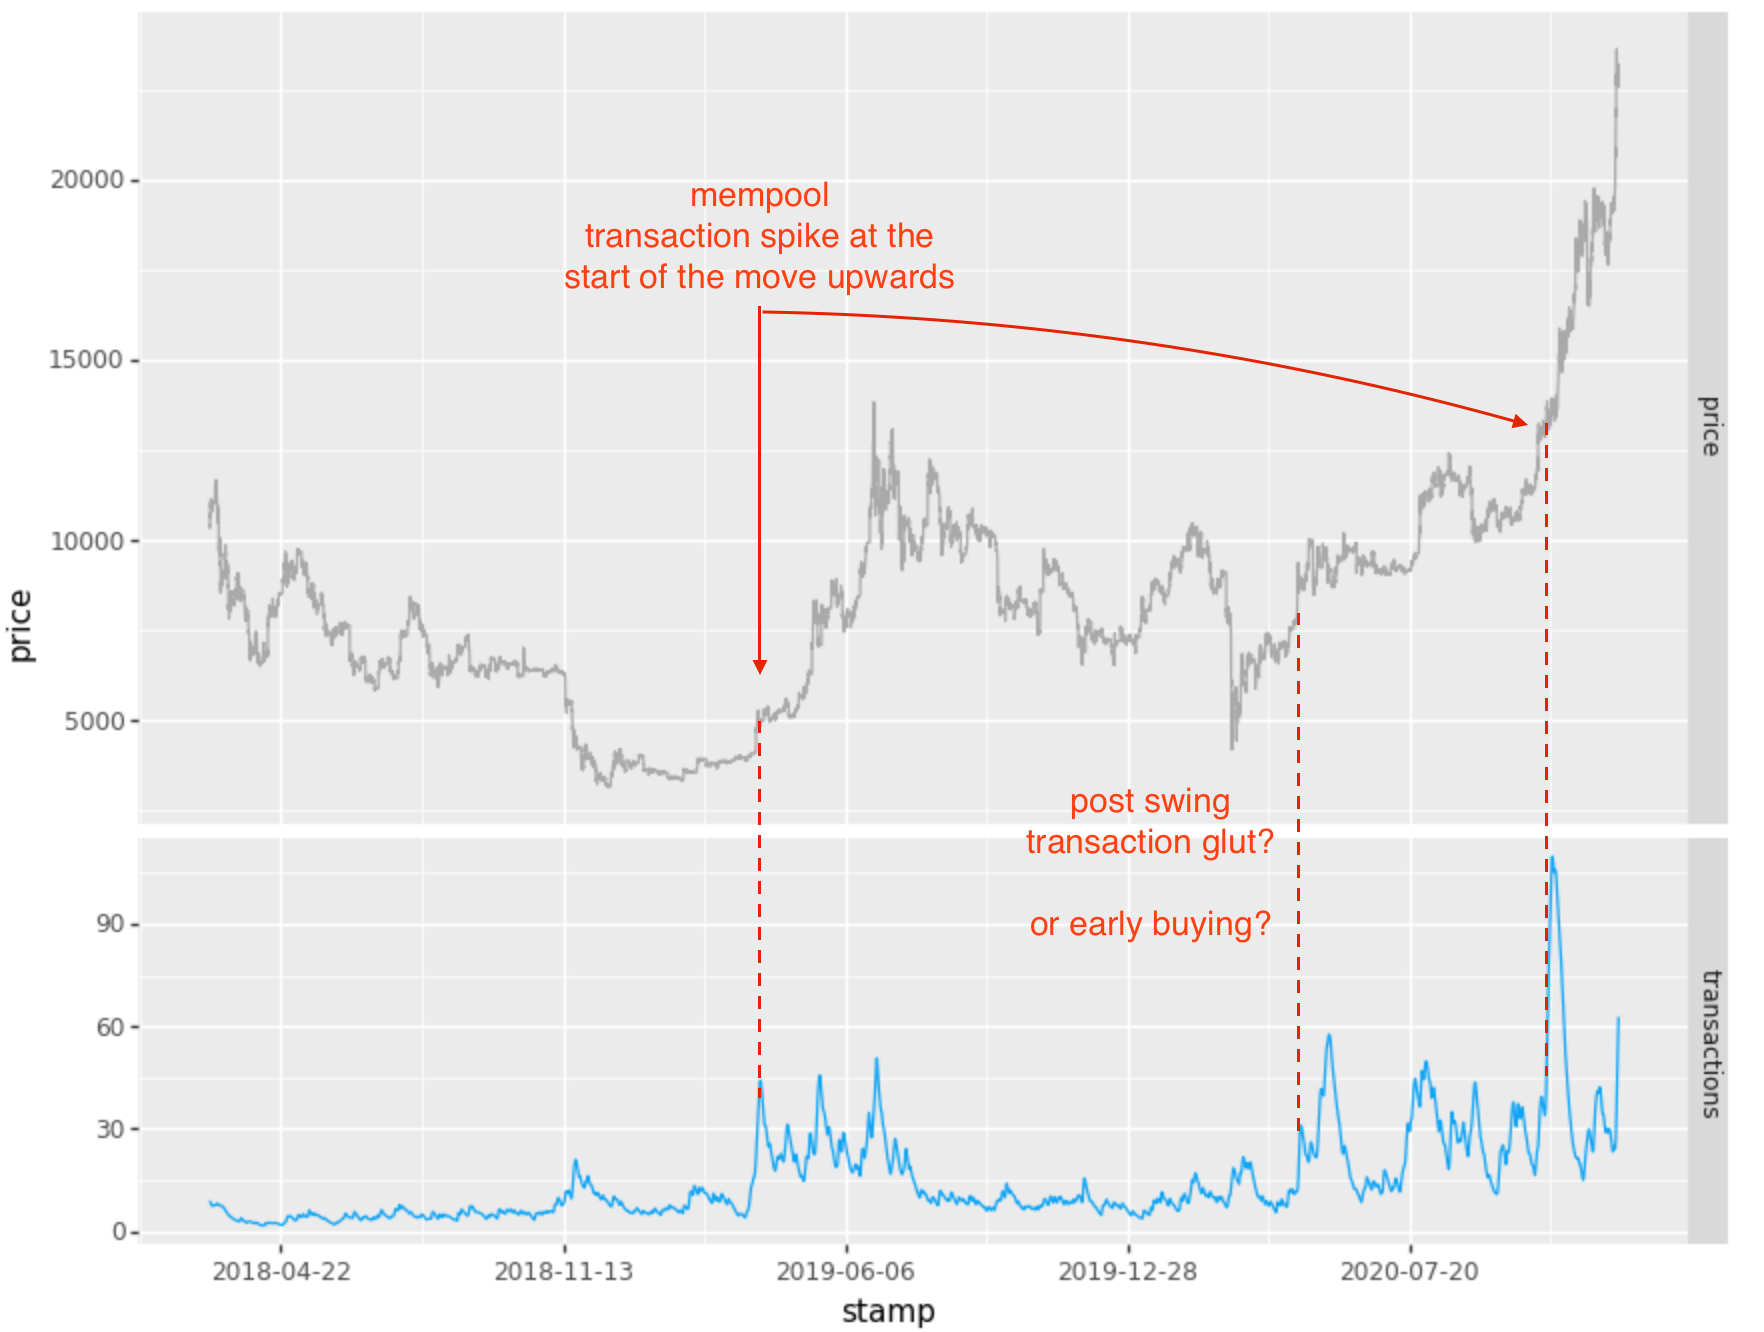
There seems to be a relationship between # of transactions and forward price move. Of course transaction count is not directional. However based on the history I have seen in Bitcoin, large transaction interest seems to presage large upward movements in price.
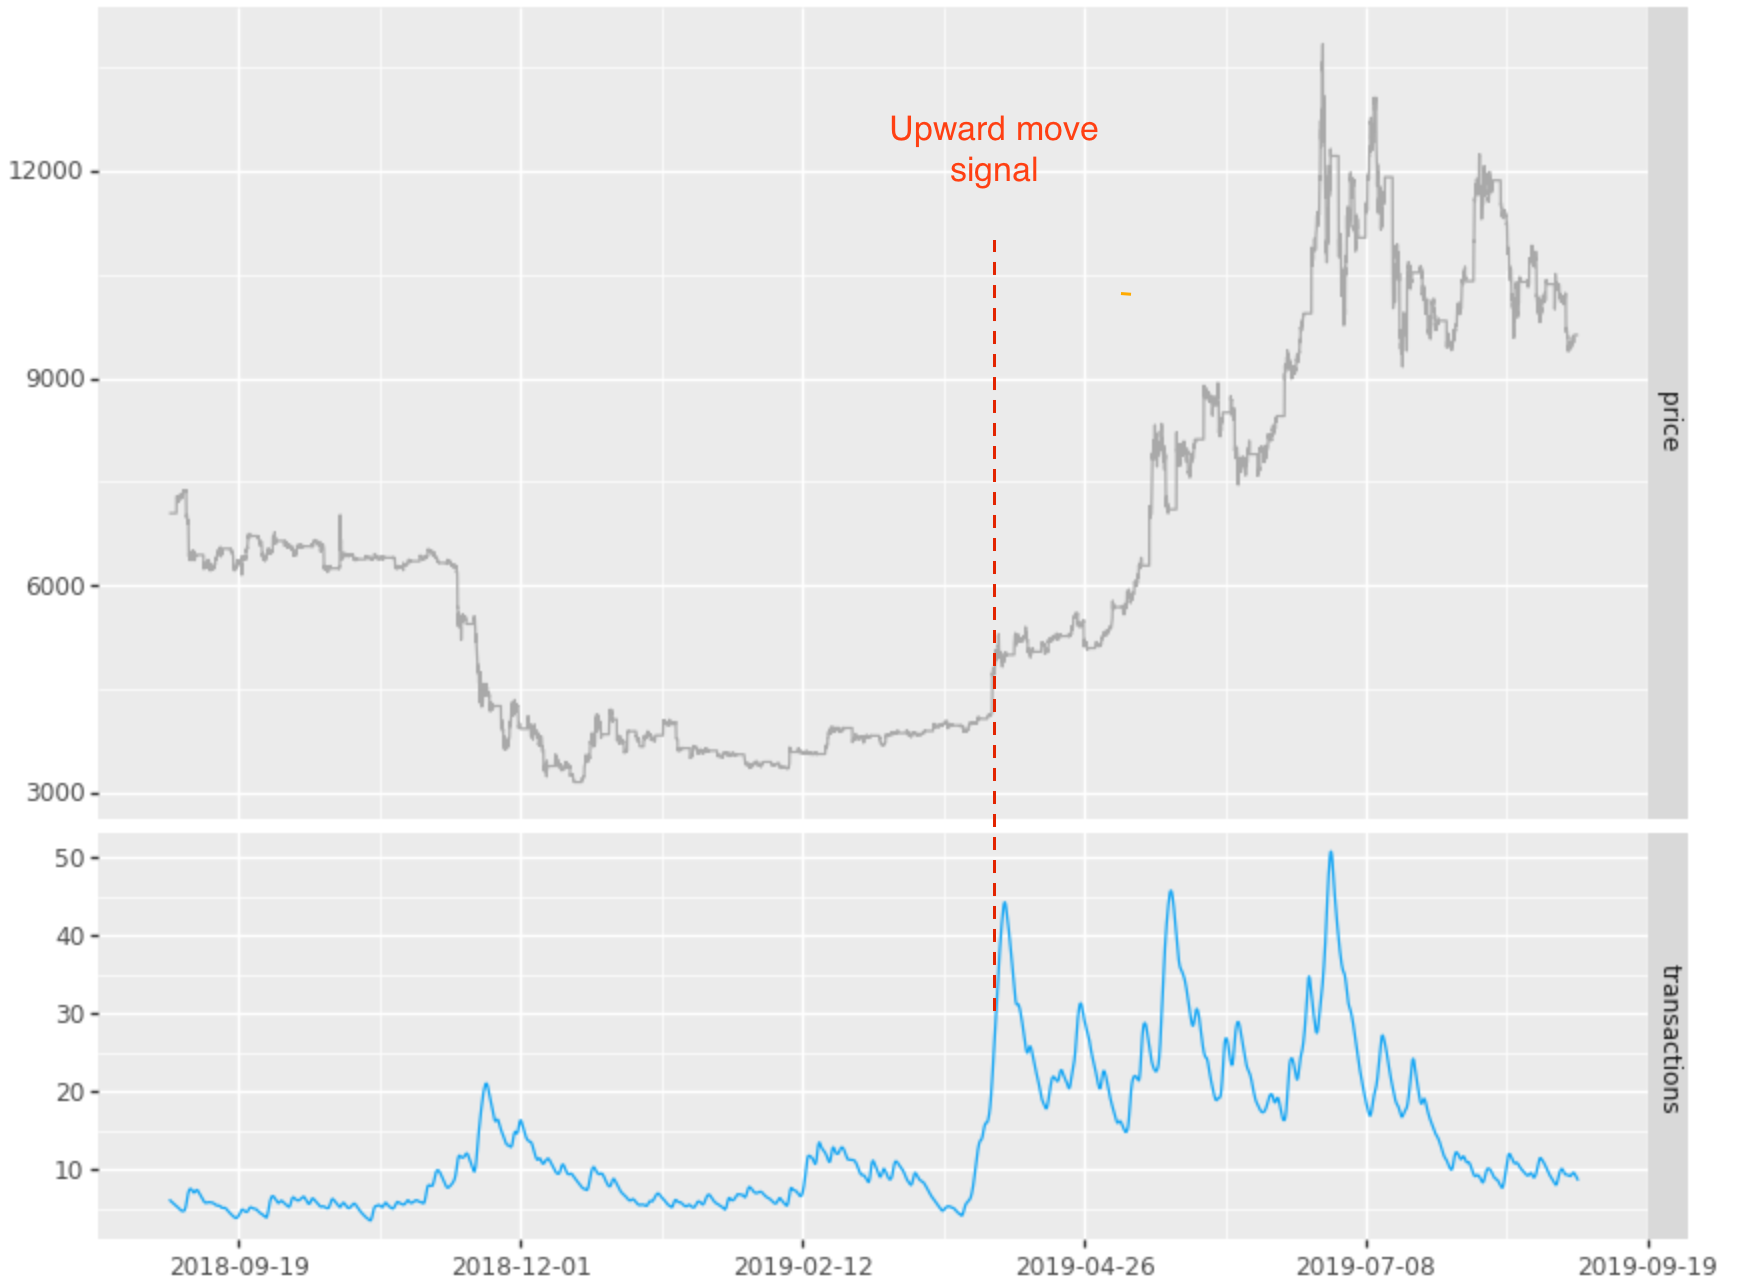
Here is a zoom in on the 2019 move:
Tentative Conclusions
- There seems to be some relationship between block transaction count and forward price move
- Too short of a history to have a high degree of statistical confidence.
- Narrative seems makes sense, however
I have not put all that much time into longer-term signals in crypto, but am sure there are more that can be employed. A friend of mine pointed me to the site: glassnode, which has a number of different metrics which may be useful.
Would also note that transaction count (as of 2020-12-18) is signalling high currently, so may point to continued price appreciation beyond current levels - we shall see.
Addendum
(2020-12-19) The transaction spike that started on Dec 16th was descending from the high on Dec 18th. Bitcoin continued upward 5% or so and then went sideways post Dec 19th. Here is a good site for observing the transaction activity transaction spike activity. Looks like the move is done for now.